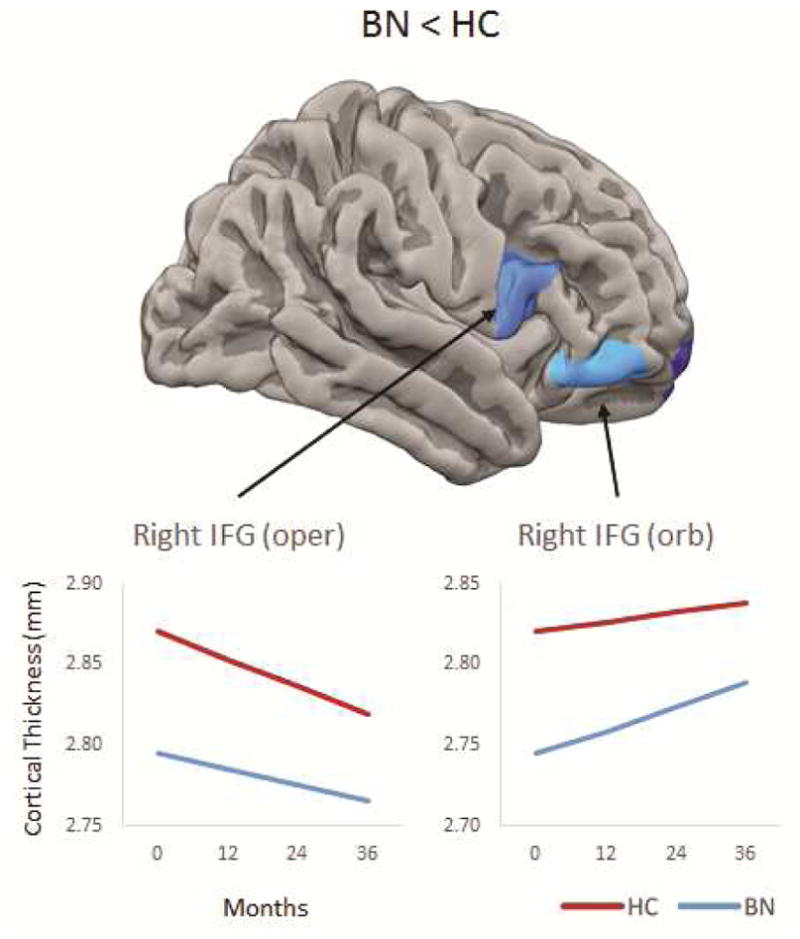
Figure 1. Group differences in cortical thickness (CT) over time.

Note: Top images shows group differences in CT at baseline; line graphs show differences yearly based on point slope estimates at 0, 12, 24, and 36 months. Remission is defined as at least 50% reduction in the frequency of objective bulimic episodes (OBEs) and vomiting episodes between baseline and last assessment. BN = bulimia nervosa; HC = healthy control; IFG = inferior frontal gyrus.
