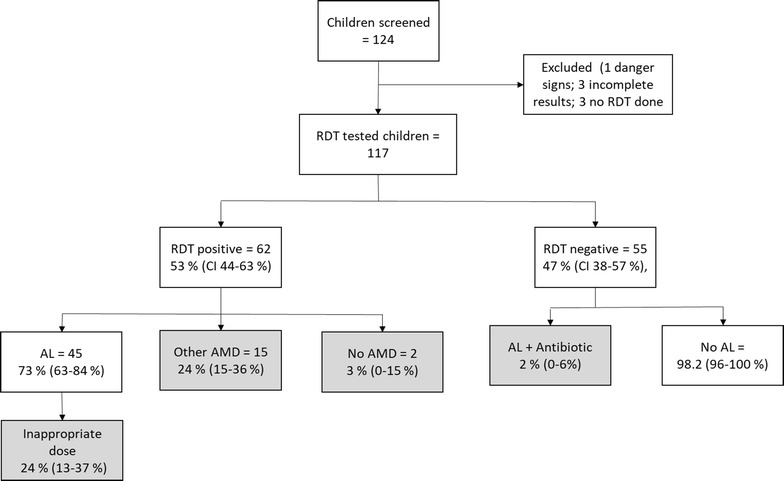
Fig. 3.

Flow chart for enrolment of participants, mRDT results, and treatment provided. Number of patients inappropriately managed according to the guidelines are shown in the grey shaded boxes. Numbers in parentheses are 95% confidence interval of the proportions. AMD antimalarial drug, AL artemether–lumefantrine, mRDT malaria rapid diagnostic test, SP sulfadoxine–pyrimethamine
