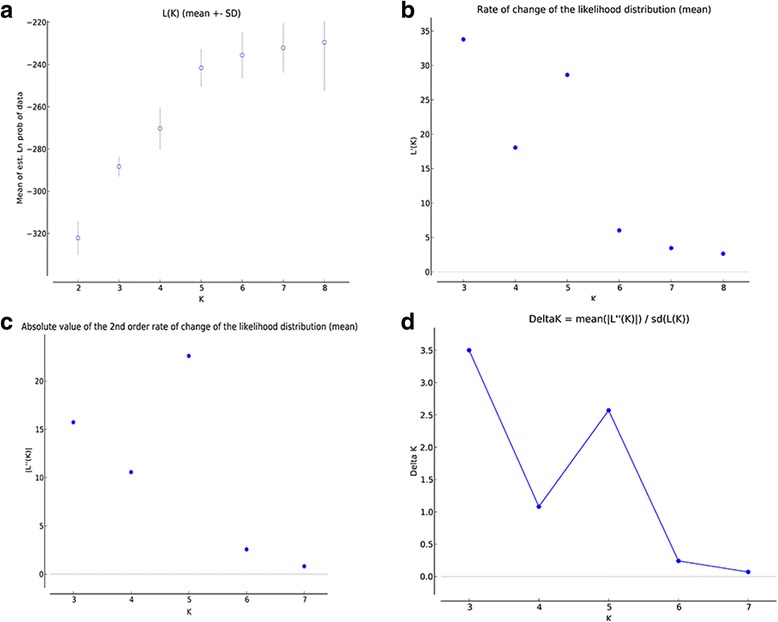
Fig. 3.

K value calculation for population substructuring after burn-in length of 104 and 105 replicates of 20 Markov chain Monte Carlo simulation runs. a Plot of mean likelihood L (K) and variance per K value from STRUCTURE on a dataset containing 36 specimens for five loci. b-d Plots for detecting the number of K groups that best fit the data, where (d) represents the peak delta K value of 3
