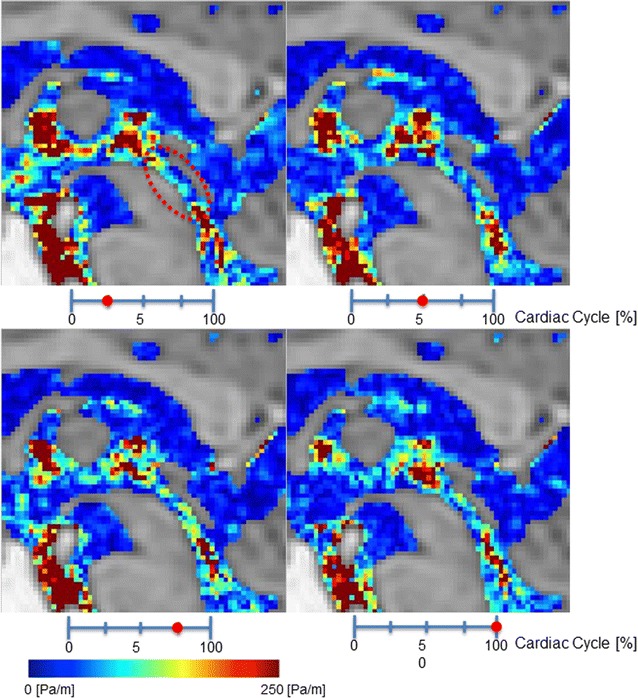
Fig. 3.

Pressure gradient color mapping of the volunteer by 3D-PC at 4 stages of the cardiac cycle. The intensity of the pressure gradient was indicated using a color scale. The color-coded CSF pressure gradient were then superimposed onto T2-weighted images of the stationary tissues. Red circle indicates Sylvian aqueduct
