Fig. 5.

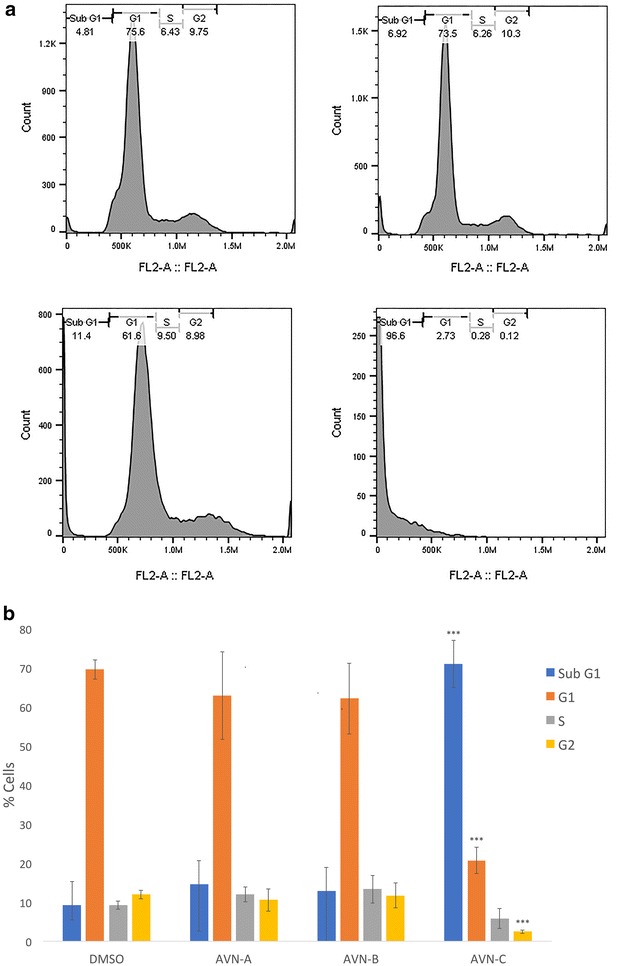
AVN-C causes DNA fragmentation and an accompanying accumulation of cells in a sub G1 population a Representative sample of flow cytometric analysis of cell cycle after fixation and staining with PI after treatment with DMSO 0.4% (vehicle) or AVN-A, B, or C at 400 µM for 96 h. b Graphical representation of average % cells in each stage of the cell cycle for three biological replicates done in triplicate. * Indicates statistical significance difference (when comparing each stage of the cell cycle) from 0.4% DMSO negative control as determined by a t test at p < 0.05 level of significance, ** indicates significance level at p < 0.01, *** indicates significance at a p < 0.001 level
