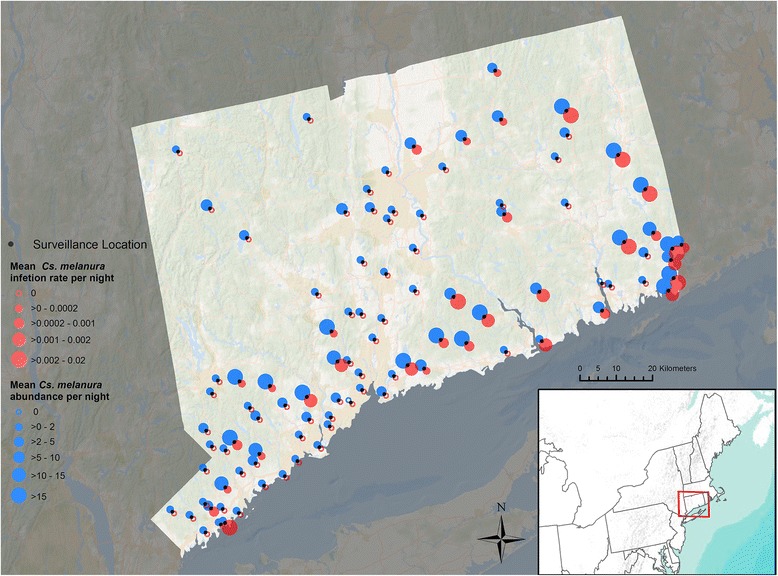
Fig. 1.

Study extent, sample locations, vector abundance and vector EEEV infection rate for all sampling years (2001–2014). Black points mark each of the mosquito trapping locations. The size of the blue circle above the black point represents mean Cs. melanura abundance per sampling night at the sampling location and the size of the red circle below the black point reflects the mean EEEV infection rate of Cs. melanura at the sampling location
