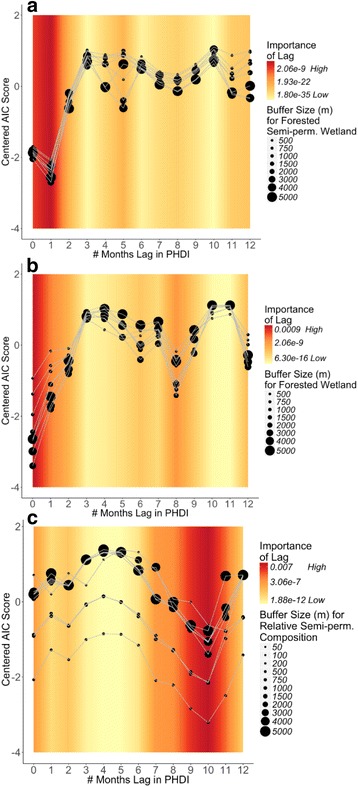
Fig. 2.

Relative importance of spatial scales and temporal lags. Each plot highlights the particular monthly lags in hydrological wetness conditions (PHDI) and the spatial scales (for wetland variables) that are included in the best performing models (determined by AIC). Each black point represents a different model explaining either Cs. melanura abundance (a, b) or EEEV presence/absence (c). Each model has a unique combination of spatial scale for the wetland variable (represented by point size) and monthly lag in hydrological conditions (PHDI; x-axis value). A different wetland variable is included in each plot: (a) forested semi-permanent wetlands; (b) forested wetlands; and (c) the abundance of forested semi-permanent wetland relative to other wetland types. The y-axis lists AIC scores for each model centered on the mean AIC score of all the models. A lower centered AIC score for a model suggests better performance for that spatial scale and monthly lag combination. The background color shows the interpolated relative importance of a particular monthly lag averaged across all the models included in the plot. Red bands indicate monthly lags when hydrological conditions have the highest relative importance
