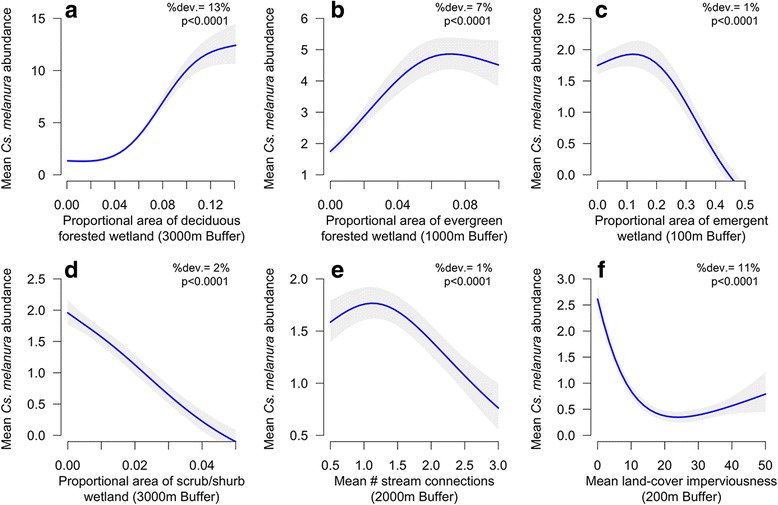
Fig. 3.

Generalized additive model (GAM) response curves depicting the relationship between mean Cs. melanura abundance per sampling night and 6 explanatory variables: (a) deciduous forested wetland; (b) evergreen forested wetland; (c) emergent wetland; (d) scrub/shrub wetland; (e) stream connectivity; and (f) impervious surfaces (Table 2). The percent of the total model deviance explained by each variable (%dev.) and associated P-values are listed in the upper right of each plot. Grey bands represent 95% confidence intervals (1.96*SE) on the estimated Cs. melanura abundance based on GAM predictions
