
Figure 2. Opsin phylogeny and gene structure analysis.
Majority consensus tree of Bayesian analysis (Phylobayes, DS-GTR + Γ, 60,000 cycles). Bayesian posterior probabilities and bootstrap values from parallel RAxML analysis are shown. See Figure 2—figure supplement 1 for uncollapsed tree and Figure 2—source data 1 for gene accession numbers. Intron positions (colored bars) are mapped on the uncurated protein sequence alignment and conserved positions are highlighted by bars spanning several sequences. See Figure 2—figure supplement 2 for full opsin gene structures and Figure 2—figure supplement 3 for intron phases. The new L. asellus opsin falls with high support into the group of xenopsins, which is only distantly related to c-opsins. All major c-opsin subgroups share three conserved intron positions. While cnidops that form the sister group of xenopsins lack introns, the two intron positions that are conserved in xenopsins do not overlap with those of c-opsin introns, indicating independent evolutionary origins for xenopsins and c-opsins. The r-opsin sequences included in the gene structure representations are those of A: Apis mellifera UV opsin; B: Limulus polyphemus UV-like opsin; C: Crassostrea gigas r-opsin 10013541; and D: Homo sapiens melanopsin.

Figure 2—figure supplement 1. Uncollapsed tree of Bayesian phylogenetic opsin analysis (Phylobayes, dataset specific model DS-GTR + Γ, 60,000 cycles).
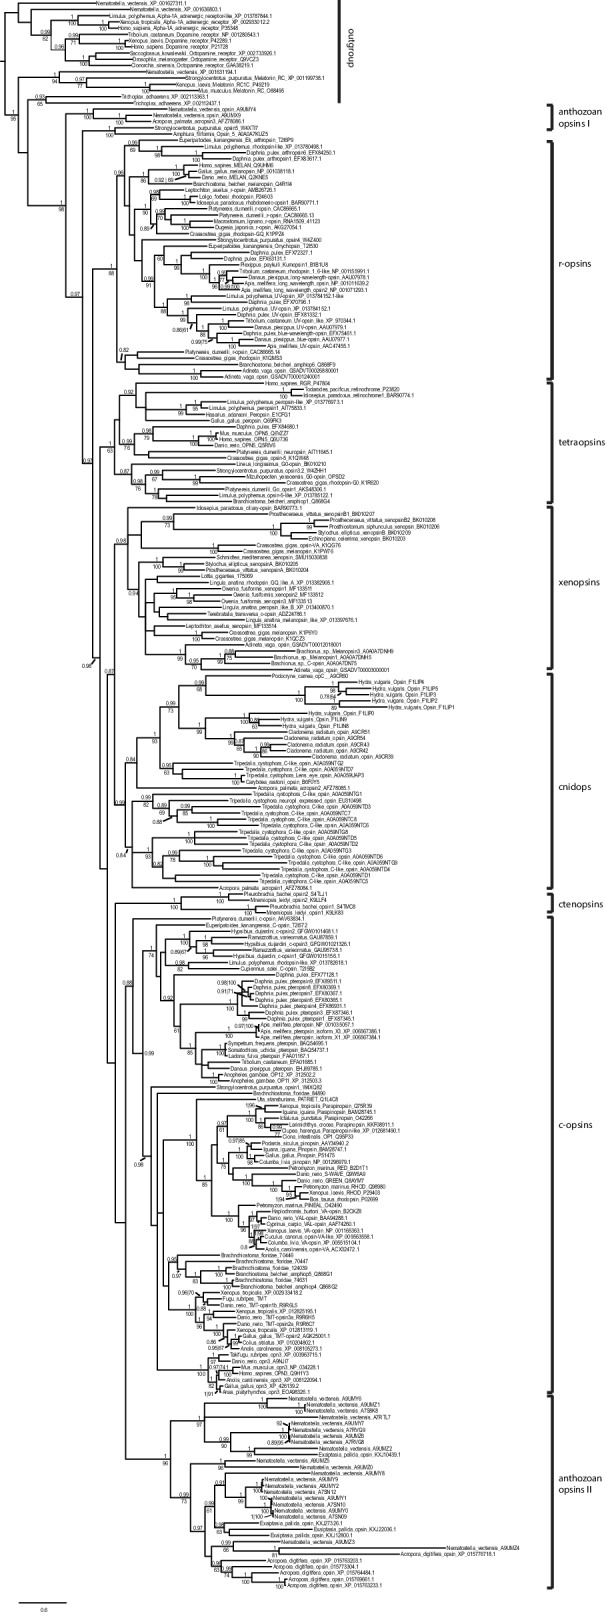
Figure 2—figure supplement 2. Opsin gene structures mapped onto a protein alignment of all opsins included in the phylogenetic analysis, where genomic information was publicly available or generated by this study as for P. dumerilii c-opsin and L. asellus xenopsin.

Figure 2—figure supplement 3. Intron phase analysis of all opsins included into the phylogenetic analysis, where genomic information was publicly available or generated by this study, showing that the type-specific introns in c-opsins and xenopsins are conserved not only by position but also by intron phase.
