. 2017 Sep 6;6:e23435. doi: 10.7554/eLife.23435

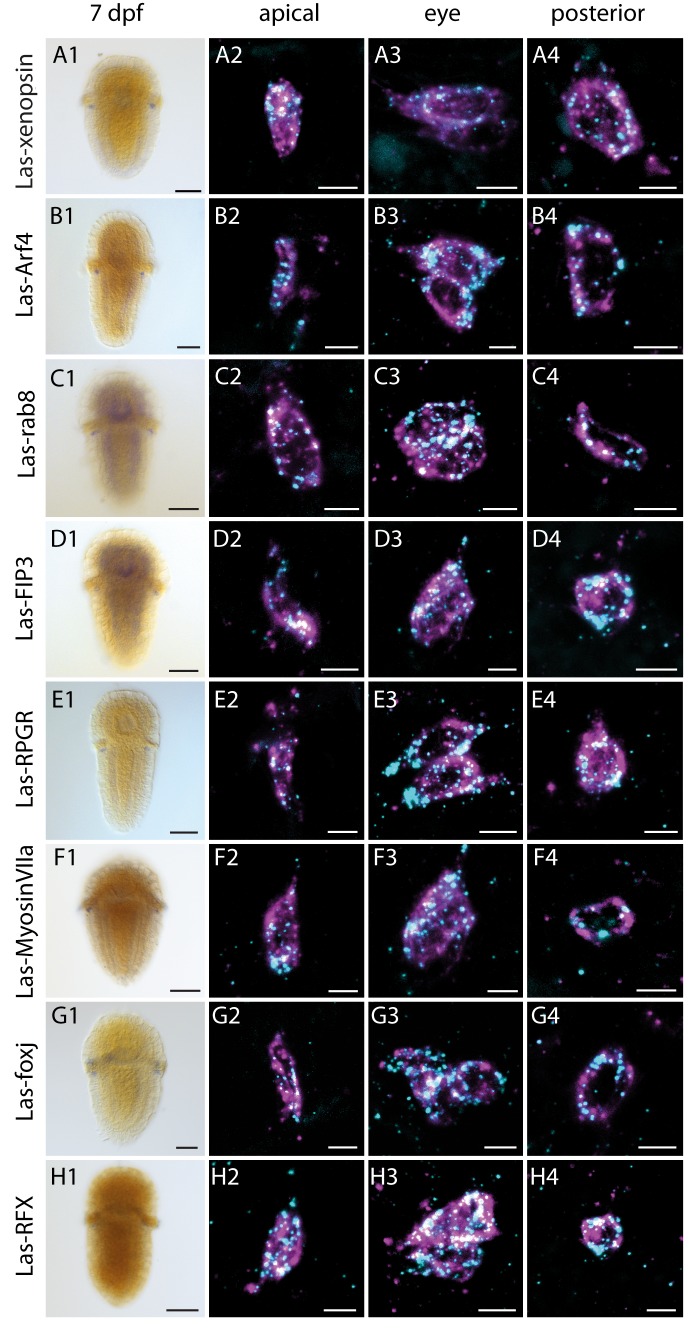
Figure 4. Expression of Las-xenopsin as well as genes involved in ciliary opsin transport and development of cilia.

Column 1: single labeling of gene X. Column 2–4: double labeling of gene X (cyan) and Las-r-opsin (magenta) in the anterior, posttrochal eye and posterior regions. Las-xenopsin (a1–a4), Las-Arf4 (b1–b4), Las-rab8 (c1–c4), Las-FIP3 (d1-4), Las-RPGR (e1-4), Las-Myosin VIIa (f1-4), Las-foxj1 (g1-4) and Las-RFX (h1-4) are coexpressed with Las-r-opsin in anterior, eye and posterior PRCs. Additionally, Las-rab8 (c1) and Las-FIP3 (d1) show a broader expression in the nervous system of 7 dpf larvae and Las-foxj1 shows expression also in the apical area and prototroch cells of young larvae (Figure 4—figure supplement 1). See Figure 4—figure supplements 13 for gene trees of Arf4, FIP and RFX. (Scalebars: 100 μm in column 1; 5 μm in columns 2–4).

Figure 4.

Figure 4—figure supplement 1. Las-foxj1 expression in a young larva (48 hpf).
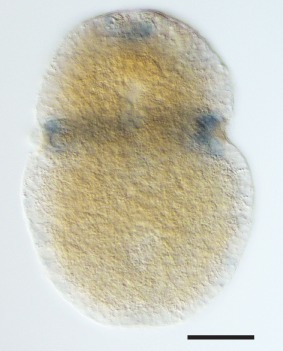
Figure 4—figure supplement 1.

Las-foxj1 is expressed in the prototroch cells and the apical organ (Scalebar: 100 μm).
Figure 4—figure supplement 2. Alignment of C-termimal ends of the opsins involved in this study.

Figure 4—figure supplement 2.

The VxPx motif known to be involved in cargo binding during ciliary opsin trafficking in vertebrate c-opsin is conserved only in tunicate and vertebrate c-opsins, but not in cephalochordate, echinoderm and prostostome c-opsins, xenopsins, cnidops or any other opsin-type.
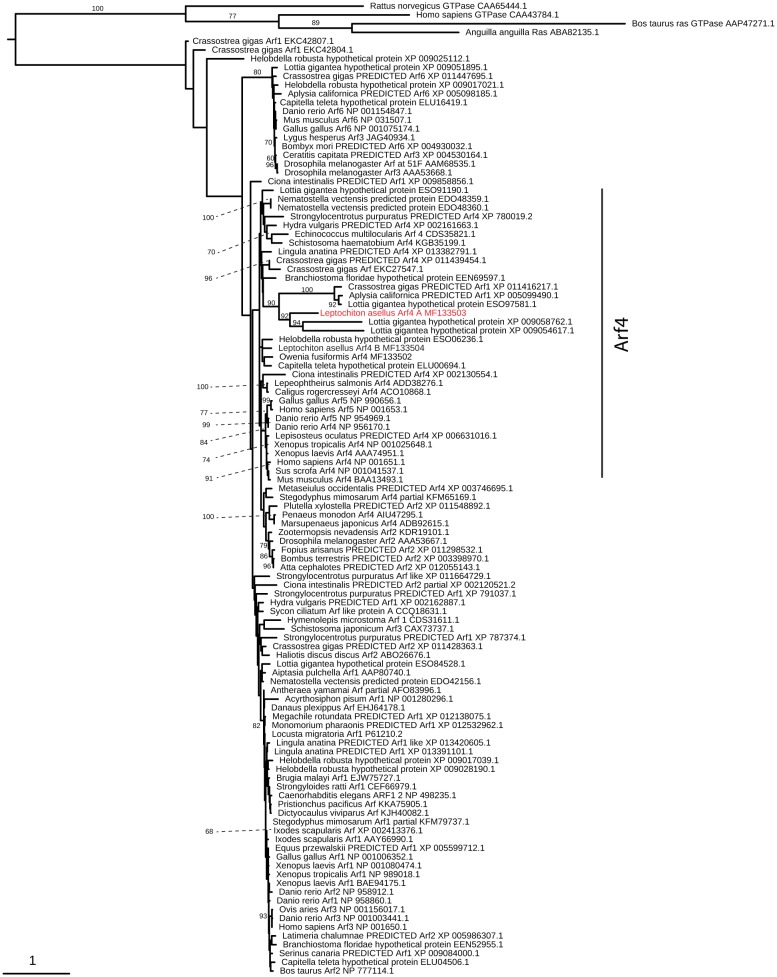
Figure 4—figure supplement 3. Arf4 evolution.

Figure 4—figure supplement 3.

Maximum-likelihood (RAXML, LG + Γ model, rapid bootstrapping (250 replicates)). See Figure 4—figure supplement 3—source data 1 for gene accession numbers.
Figure 4—figure supplement 3—source data 1. Accession numbers of sequences used for Arf4 tree inference.
DOI: 10.7554/eLife.23435.017
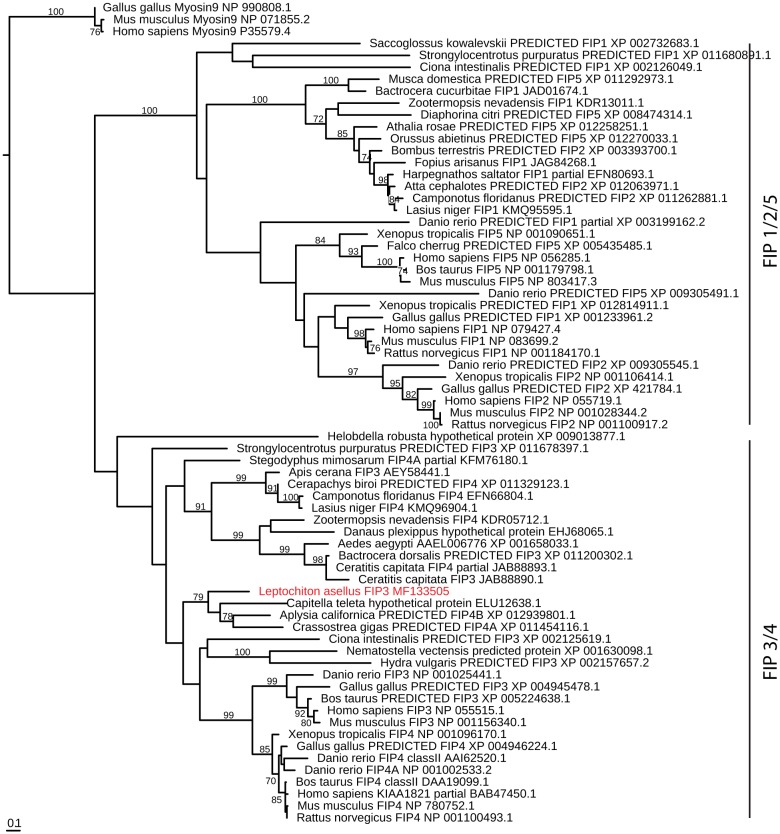
Figure 4—figure supplement 4. FIP evolution.

Figure 4—figure supplement 4.

Maximum-likelihood (RAXML, LG + Γ model, rapid bootstrapping (250 replicates)). See Figure 4—figure supplement 4—source data 1 for gene accession numbers.
Figure 4—figure supplement 4—source data 1. Accession numbers of sequences used for FIP tree inference.
DOI: 10.7554/eLife.23435.018
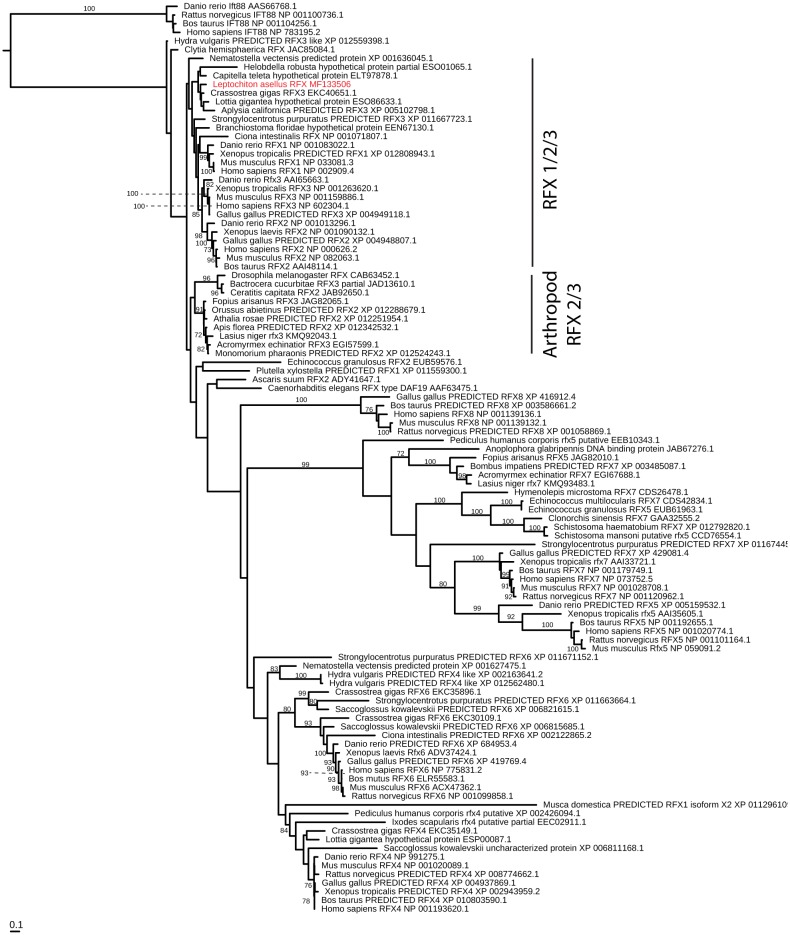
Figure 4—figure supplement 5. RFX evolution.

Figure 4—figure supplement 5.

Maximum-likelihood (RAXML, JTT + Γ + F model, rapid bootstrapping (250 replicates)). See Figure 4—figure supplement 5—source data 1 for gene accession numbers.
Figure 4—figure supplement 5—source data 1. Accession numbers of sequences used for RFX tree inference.
DOI: 10.7554/eLife.23435.019