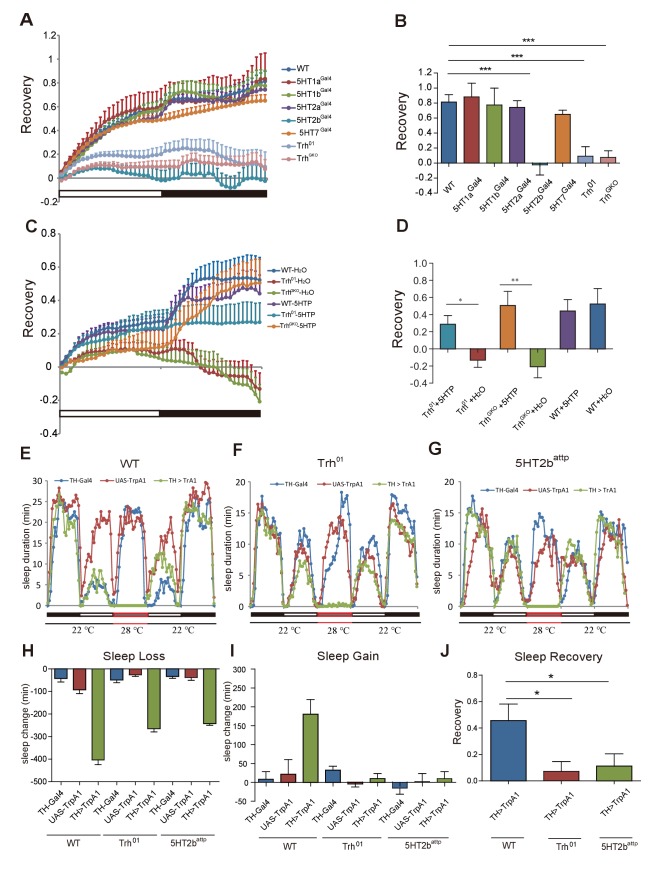
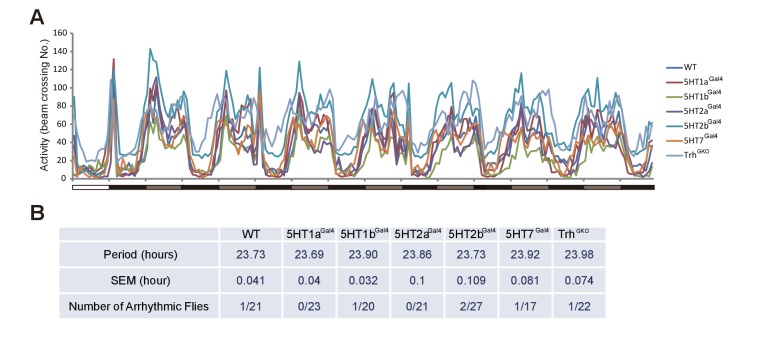
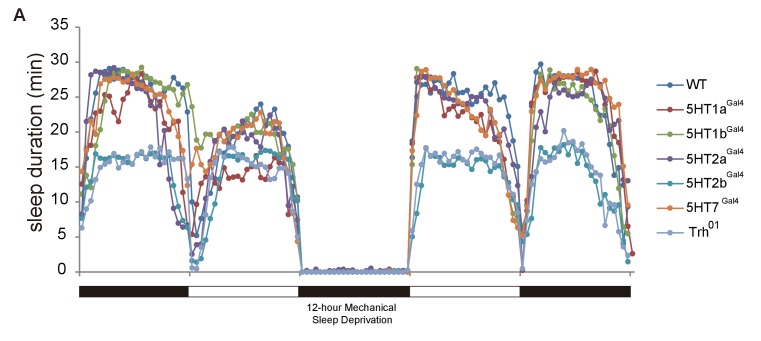
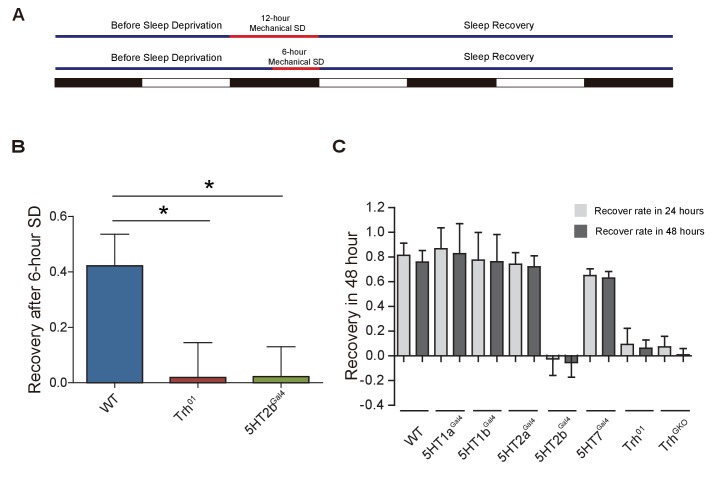
Figure 2. Sleep homeostasis in Trh and 5-HT receptor mutants.
(A) Trh and 5HT2b mutant flies regained a lower percentage of lost sleep time than wt after 12-hr overnight sleep deprivation. Other receptor mutants showed normal recovery rate after sleep deprivation. (B) Statistical analysis of sleep rebound after 24-hr recovery (mean ± SEM, n = 39 for wt, n = 38 for 5HT1a mutants, n = 38 for 5HT1b mutants, n = 38 for 5HT2a mutants, n = 45 for 5HT2b mutants, n = 47 for 5HT7 mutants, n = 44 for Trh01 mutants, and n = 42 for TrhGKO mutants, respectively). (C) Sleep recovery rate after sleep deprivation. Three-day feeding of 2 mg/ml 5HTP did not change sleep recovery in wt flies, but rescued sleep rebound in Trh01 and TrhGKO flies. (D) Statistical analysis (mean ± SEM, n = 47 for wt with H2O, n = 34 for Trh01 with H2O, n = 34 for TrhGKO with H2O, n = 48 for wt with 5HTP, n = 36 for Trh01 with 5HTP, and n = 45 for TrhGKO with 5HTP). (E–G) Sleep profiles after thermogenetical activation of dopaminergic neurons in wt (E), Trh mutant (F), or 5HT2b mutant flies (G). (H) Sleep loss during neural activation. (I) Sleep gain over 24 hr after thermogenetically induced sleep deprivation. (J) Statistical analysis of sleep rebound after 24-hr recovery. (E–J, n = 32–48 for each strain). One-way ANOVA was used to detect statistical difference between different genotypes. *p<0.05, **p<0.01, ***p<0.001.


