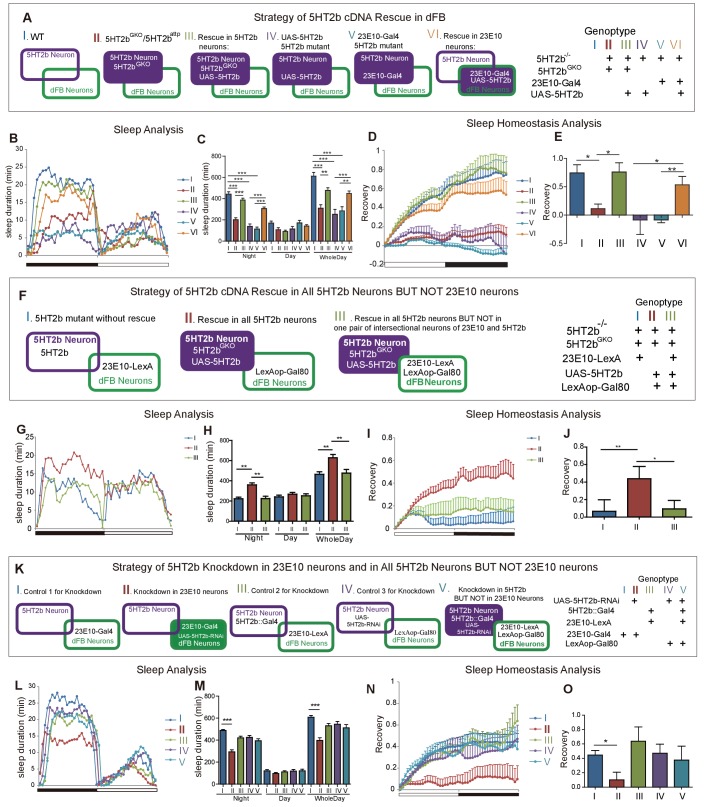
Figure 6. Regulation of sleep and sleep homeostasis by the 5HT2b gene in one pair of dFB neurons.
(A) Schematic illustration of genetic rescue with 5HT2b cDNA in 5HT2b mutants. (B) Sleep profile for 5HT2b homozygous heterzygous mutants and genetic rescue lines with 5HT2bGKO or 23E10-Gal4. (C) 5HT2b mutants slept less than wt or genetic rescue stains with 5HT2bGKO or 23E10-Gal4 (mean ± SEM, n = 48 for I, n = 48 for II, n = 48 for III, n = 848 for IV, n = 32 for V and n = 48 for VI). (D and E) Heterozygous mutants and flies with 5HT2b cDNA restored in 5HT2b or 23E10 neurons had normal recovery rate after 12-hr sleep deprivation (D). (E) Statistical analysis (mean ± SEM, n = 43 for I, n = 47 for II, n = 36 for III, n = 25 for IV, n = 31 for V and n = 33 for VI). (F) Schematic illustration of genetic rescue in 5HT2b but not 23E10 neurons. (G) Sleep profile for the 5HT2b homozygous mutant and genetic rescue in 5HT2b neurons and genetic rescue lines in all 5HT2b neurons but not in 23E10 neurons. 5HT2b mutant flies and flies with 5HT2b rescue in all 5HT2b neurons but not in 23E10 neurons were similar in sleep duration during both days and nights, but slept less than genetic rescue strains with 5HT2bGKO in night-time sleep (G). (H) Statistical analysis (mean ± SEM, n = 48 for I, 48 for II, and 46 for III, respectively). (I–J) 5HT2b mutant flies and flies with 5HT2b rescue in all 5HT2b neurons but not 23E10 neurons showed impaired sleep homeostasis (I). (J) Statistical analysis (mean ± SEM, n = 41 for I, n = 40 for II, and n = 43 for III). (K) Schematic illustration of 5HT2b gene knockdown in 23E10 neurons or in all 5HT2b neurons but not 23E10 neurons. (L) Sleep profile for strains of 5HT2b gene knockdown 23E10 neurons and Gal80 rescue in 23E10 neurons. Gene knockdown in dFB neurons showed shortened sleep duration (II), and the Gal80 rescued strain (V) showed normal sleep duration. (M) Statistical analysis (mean ± SEM, n = 46 for I, n = 42 for II, n = 43 for III, n = 48 for IV and n = 44 for V). (N–O) Gene knockdown in dFB neurons showed abnormal sleep homeostasis, and the Gal80 rescued strain (V) was able to restore the sleep homeostasis. (O) Statistical analysis (mean ± SEM, n = 43 for I, n = 30 for II, n = 37 for III, n = 48 for IV and n = 35 for V). One-way ANOVA was used to detect statistical difference between different genotypes. *p<0.05, **p<0.01, ***p<0.001.


