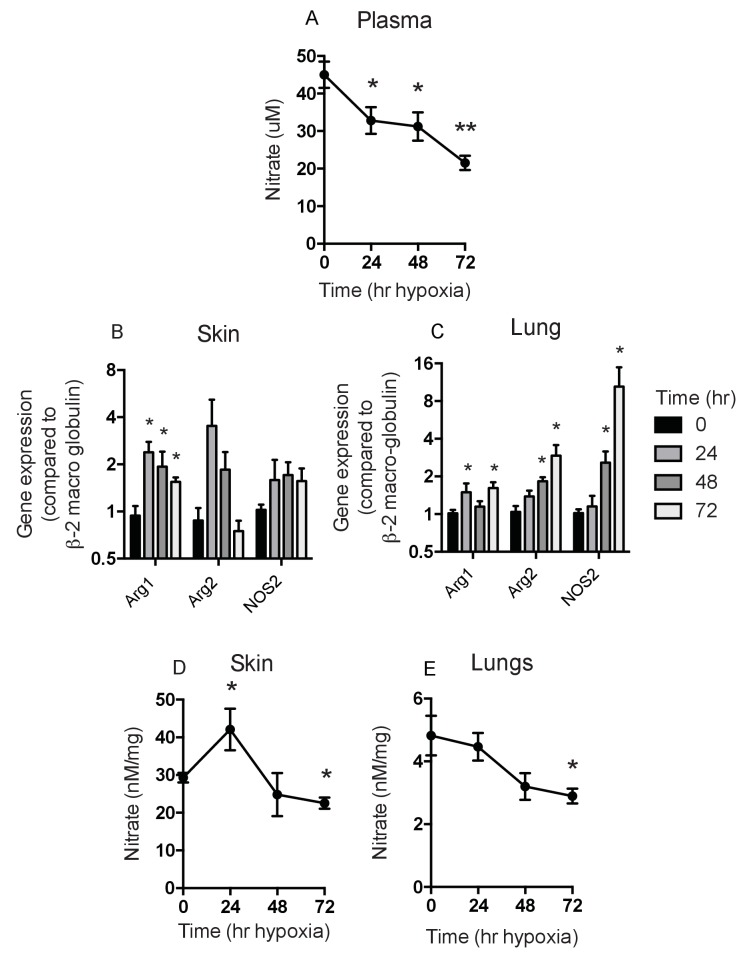
Figure 5. Analysis of Nitrates and NOS2–arginase gene expression.
Tissues and fluids were harvested from hypoxic mice (C57/Bl6 wild-type) at the time points shown and analysed for nitrate content and the gene expression of NOS2 and arginase-1/-2. (A) plasma nitrate concentration shown as mean ±SEM μM (n = 8). (B) Skin and (C) lung qPCR analysis of NOS2 and arginase expression. Data shown as mean ±SEM of fold change in gene expression compared to normoxia control (β−2 macroglobulin house-keeping gene using 2-ΔΔCT method)(n = 8). (D) Skin and (E) lung nitrate concentration shown as mean ±SEM μM (n = 8). Statistical analysis using mann-Whitney test (*p≤0.05 **p≤0.005).

