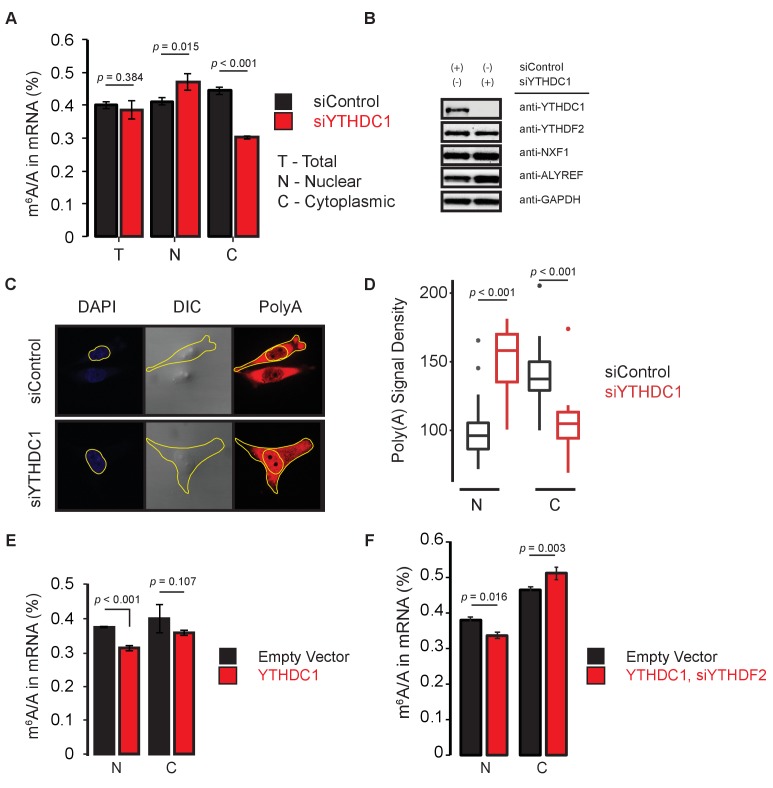
Figure 2. YTHDC1 mediates subcellular localization of methylated mRNAs.
(A) Quantification of m6A methylation in total (T), nuclear (N), and cytoplasmic (C) mRNA. Error bars represent mean ± standard deviation, n = 4, two-sided t-test with equal variance. (B) Representative western blot of YTHDF2 and members of the mRNA export pathway following knockdown of YTHDC1. (C) Representative analysis of polyA imaging. Nuclei were defined using DAPI signal. Cytoplasmic regions were defined by subtracting nuclear signal from total signal, as defined by DIC imaging. (D) Quantification of polyA signal density. n = 25, two-sided t-test. (E,F) Quantification of m6A methylation in nuclear and cytoplasmic mRNA. Error bars represent mean ± standard deviation, n = 4, two-sided t-test with equal variance.


