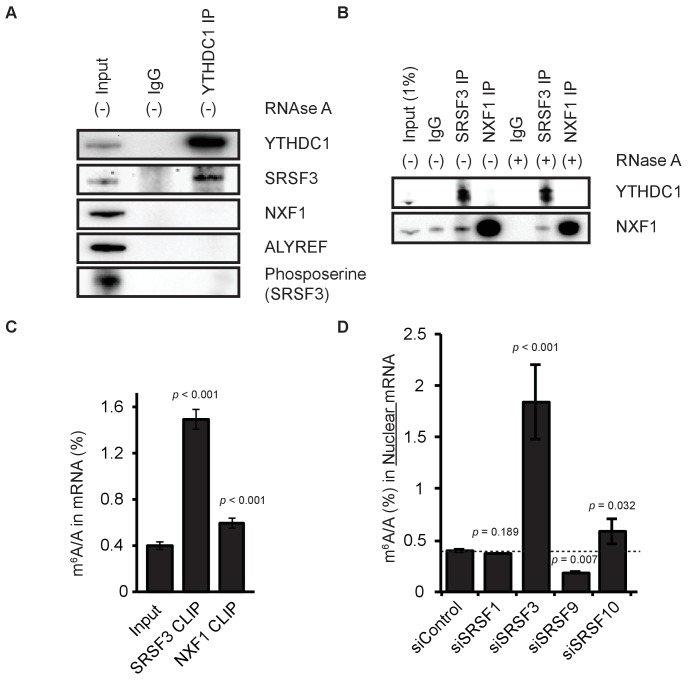
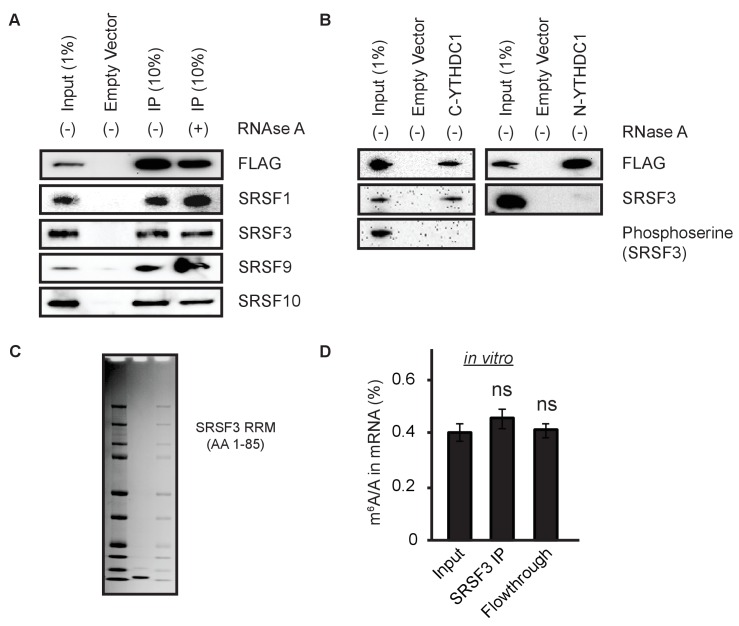
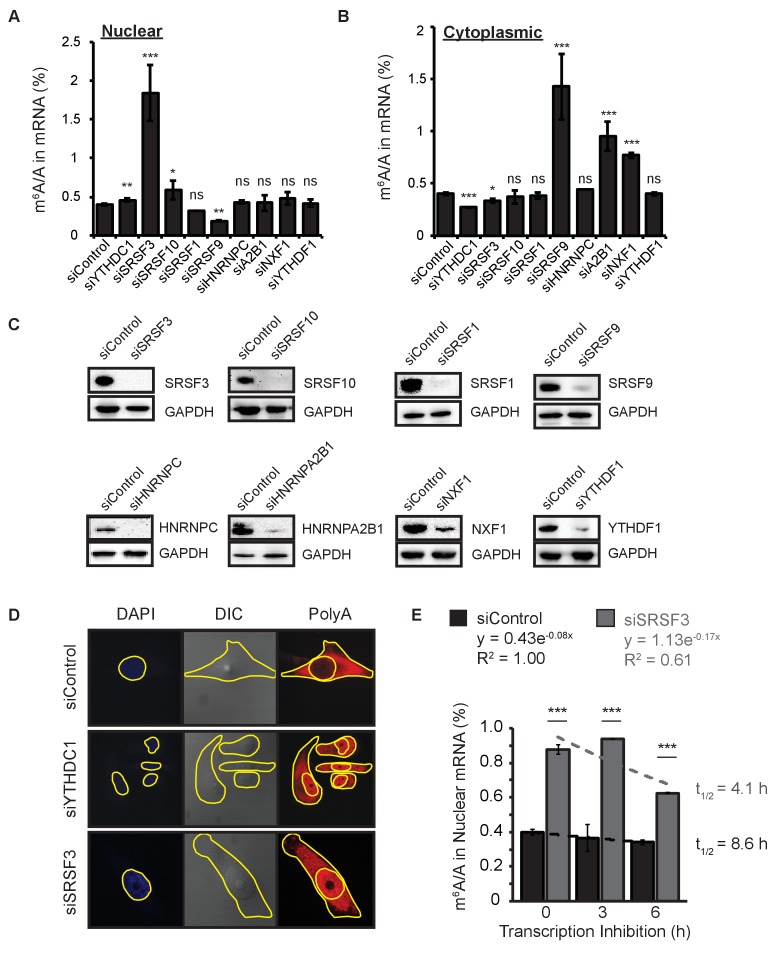
Figure 5. YTHDC1 mediates export of m6A-modified mRNA through SRSF3 and NXF1.
(A) Immunoprecipitation (IP) of endogenous YTHDC1 from HeLa cell lysate. (B) IP of endogenous SRSF3 and NXF1 from HeLa cell lysate. (C) LC-MS/MS of mRNA cross-linked to SRSF3 and NXF1. Error bars represent mean ± standard deviation, n = 4, two-sided t-test with equal variance. (D) Quantification of m6A in nuclear mRNA following knockdown of SR proteins. Error bars represent mean ± standard deviation, n = 4, two-sided t-test with equal variance.

