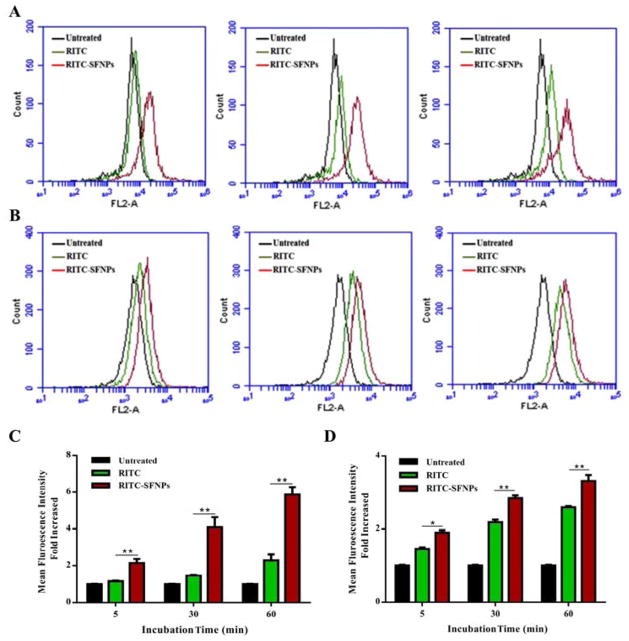
Fig. 6. Quantification of cellular uptake of SFNPs. Uptake analysis of RITC-SFNPs using flow cytometry. Untreated cells and the cells treated with free RITC were used as negative control and positive controls respectively.
A. MIA PaCa-2, with an incubation time of 5 min, 30 min, and 60 min. B. PANC-1, with an incubation time of 5 min, 30 min and 60 min. (Mean ± SD, n = 5; *: P<0.05, **: P<0.01)

