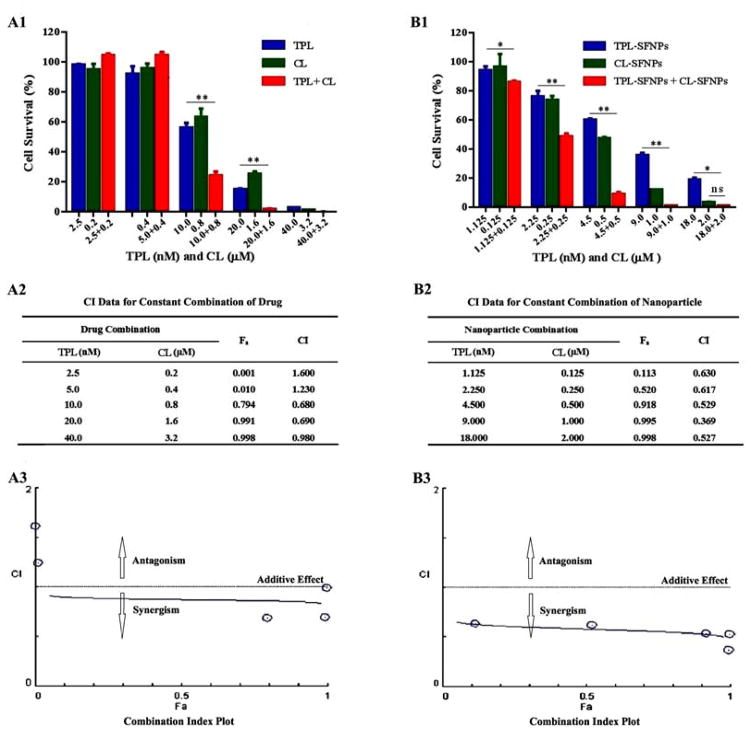
Fig. 9. Synergistic effect of TPL and CL, TPL-SFNPs and CL-SFNPs in MIA PaCa-2 cell line.
(A1) Cell viability determination and (A2) combination index (CI) value identified using Compusyn software and (A3) combination index plot of CL, TPL and in combination. (B1). Cell viability determination and (B2) combination index (CI) value identified using Compusyn software and (B3) combination index plot of TPL-SFNPs, CL-SFNPs and in combination.

