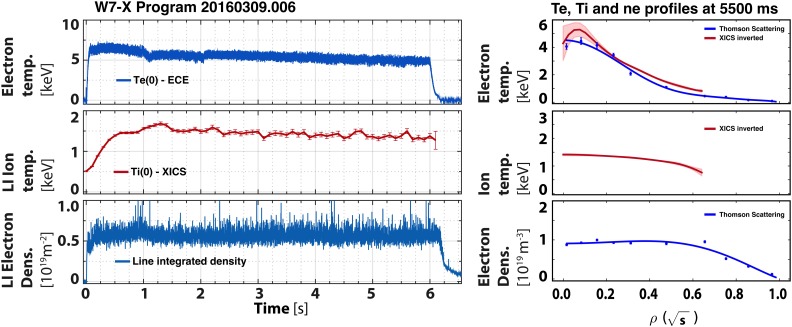
FIG. 4.
Time traces (left) and profiles (right) of electron and ion temperatures and electron density for a 6 s discharge, 20160309.006. The time trace for density is noisy due to suboptimal performance of the interferometer laser on that shot, not due to any unusually large density fluctuations. The profile data are taken at t = 5.5 s where the heating power was 0.6 MW.

