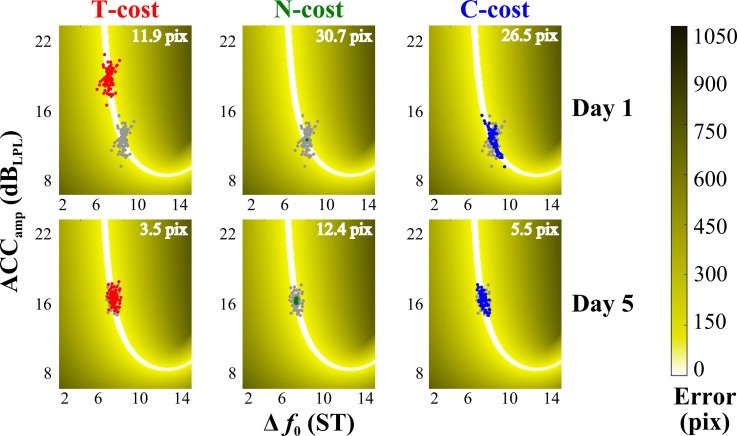
FIG. 2.
(Color online) Exemplary and corresponding virtual sets of two practice blocks from one subject, used to illustrate the tolerance noise covariation cost analysis method (T-cost, N-cost, and C-cost, respectively). The left column shows data optimized in terms of T-cost; the middle column shows data optimized in terms of N-cost, and the right column shows data optimized in terms of C-cost. Gray circles represent actual throws made by the subject's phonatory gesture, and red, green, or blue circles represent surrogate data with one component idealized (tolerance, noise, or covariation, respectively). The panels in the top and bottom rows show data from the first block of practice on day 1 and the last block of practice on day 5, respectively.

