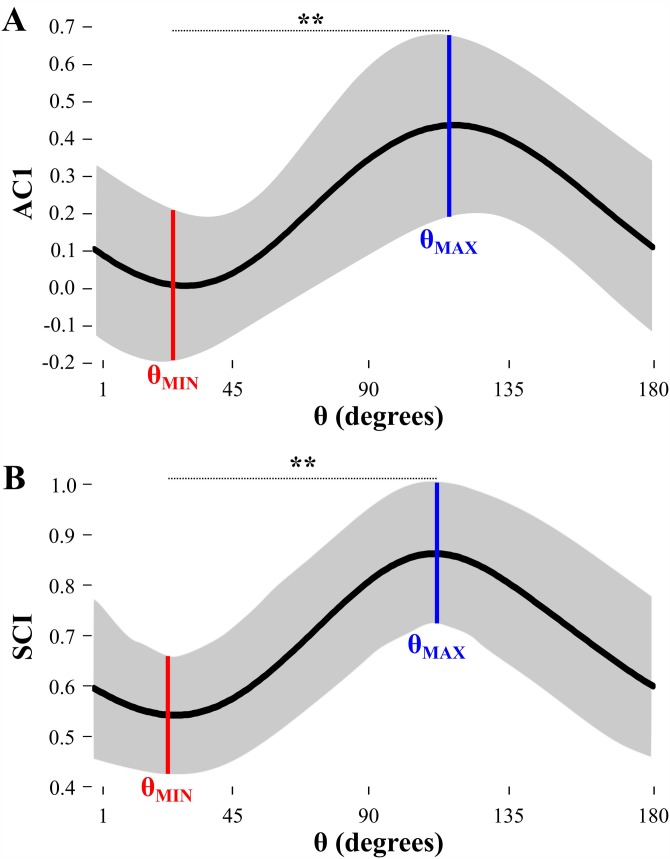
FIG. 5.
(Color online) Analysis of temporal variability and directionality in execution space. (A) Lag-1 autocorrelation coefficient (AC1) and (B) detrended fluctuation analysis scaling index (SCI) of xθ(i) as a function of rotation angle θ across all subjects' last day of practice (three blocks of 100 trials each). Solid horizontal black curves show the mean measure across all 30 practice blocks in each group, and shaded areas represent ±1 standard deviation around the mean. θ is indicated for which AC1 and SCI are minimum (θMIN) and maximum (θMAX), with their difference statistically significant (**p < 0.01).

