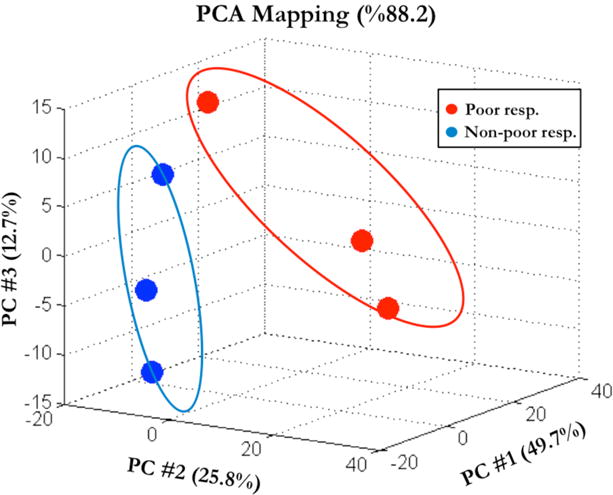
Figure 1.

Principal component analysis (PCA) of miRNA expression in cumulus cells of poor responder (red circles) and non-poor responder samples (blue circles). The percentages of variability represented by the first three principal components are displayed across PC#1, 2 and 3 on X, Y and Z axes, respectively.
