
Figure 2. Cadherin composition impacts matrix invasion by EOC cells and MCAs.
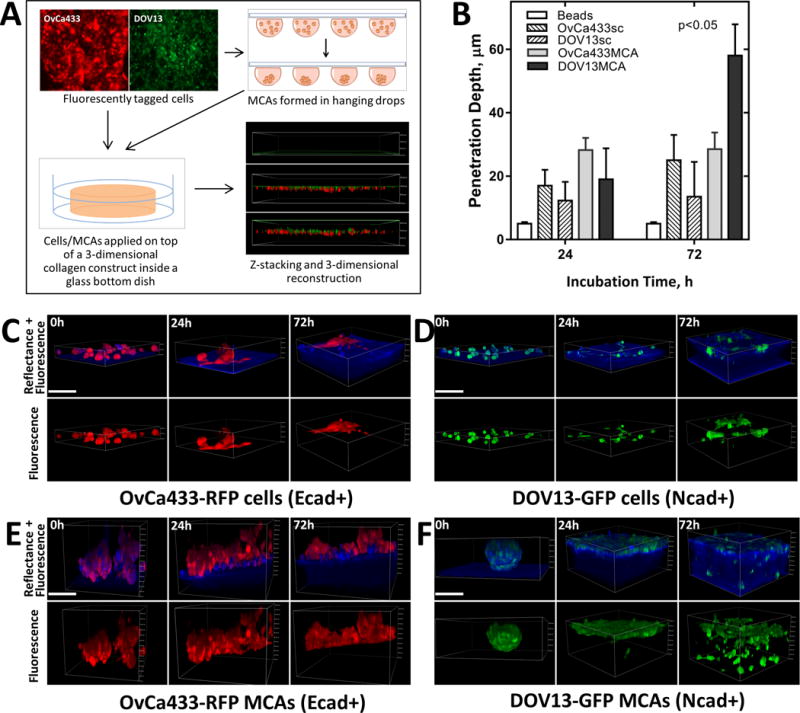
A) Overview of collagen invasion live imaging assay. EOC cells are fluorescently tagged with RFP or GFP via lentiviral transduction and applied as either individual cells or pre-formed MCAs on top of a 3D collagen gel (1.5mg/ml collagen concentration in complete medium) inside a glass-bottom dish. Continuous z-stack imaging of cell/MCA dynamics (green or red) and collagen (blue) was performed using confocal fluorescence and reflectance modes, respectively. B–F) Imaging and analysis of collagen invasion. Multiple representative z-stack snapshots of (C) OvCa433-RFP (Ecad+) cells, (D) DOV13-GFP (Ncad+) cells, (E) OvCa433-RFP (Ecad+) MCAs, (F) DOV13-GFP MCAs, and (Suppl. fig. 2) control fluorescent beads were obtained for up to 72h, and depth of penetration depth quantified (Mean±SD, N=100 in three assays);scale bar: 100μm. Statistical significance shown between the penetration depth of each cell line relative to fluorescent beads; p<0.05, Mann-Whitney U test.