
Figure 3. EOC individual cells and MCAs exhibit distinct rates of lateral motility.
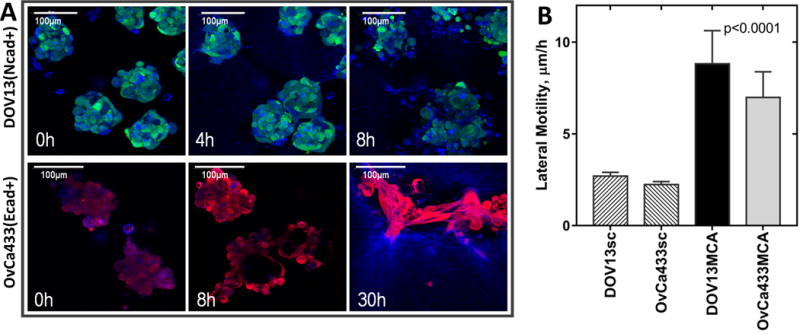
DOV13-GFP (Ncad+) and OvCa433-RFP (Ecad+) individual cells or MCAs were applied on top of a 3D collagen gel construct (1.5mg/ml) inside a glass-bottom dish; 8-hour time-lapse confocal imaging of cell/MCAs (green or red) and collagen matrix (blue) was performed in fluorescent and reflectance modes, respectively. A) Representative images of DOV13-GFP and OvCa433-RFP MCA dynamics are shown at stated time points (scale bars as indicated). B) Evaluation of lateral motility for different cell types (Mean±SD); all assays were repeated in triplicate; statistical significance shown between the lateral motilities of each cell line and fluorescent beads; p<0.05, Mann-Whitney U test.