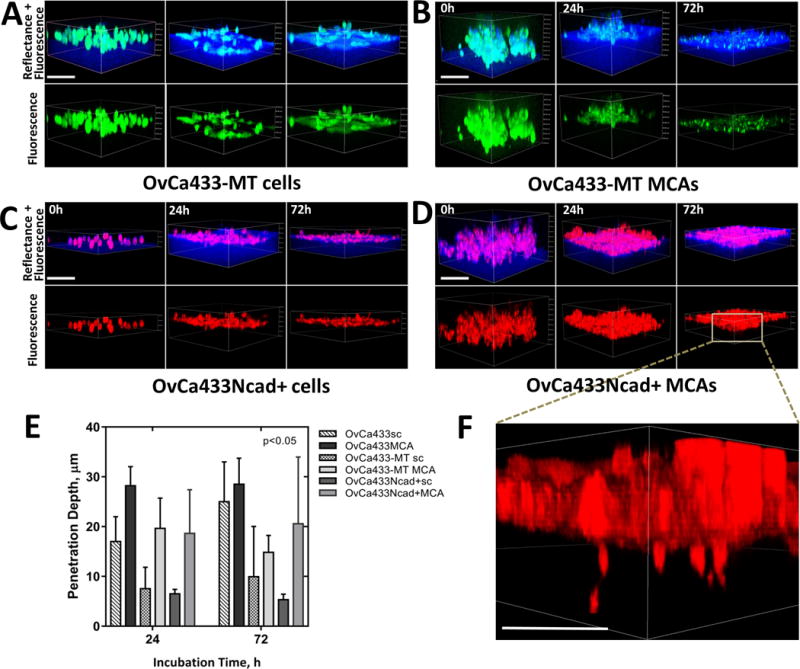
Figure 5. Acquisition of MT1-MMP or Ncad by Ecad+ EOC cells is not sufficient to induce matrix invasion.

Ecad+ OvCa433MT1 and OvCa433Ncad+ cells were transiently stained with green CMFDA or red CMTPX CellTracker dyes, respectively, as described in Methods, applied atop 3D collagen gels (1.5mg/ml) inside a glass-bottom dish as individual cells (A and C) or MCAs (B and D), and imaged in confocal fluorescence (cancer cells, green or red) and reflectance (collagen, blue) modes over the course of incubation. Scale bars: 100μm. E) Matrix invasion by cells evaluated in terms of cell penetration depth changes with incubation time (M±SD, N=100 single cells and 30 MCAs of three assays). Statistical significance shown between the penetration depths of each cell type and passive beads; p<0.05, Mann-Whitney U test. F) Enlarged 3D view of OvCa433Ncad+ MCA dispersed on collagen after 72h of incubation is shown. Scale bar: 50μm.
