


Figure 6. Blocking Ncad suppresses matrix invasion.
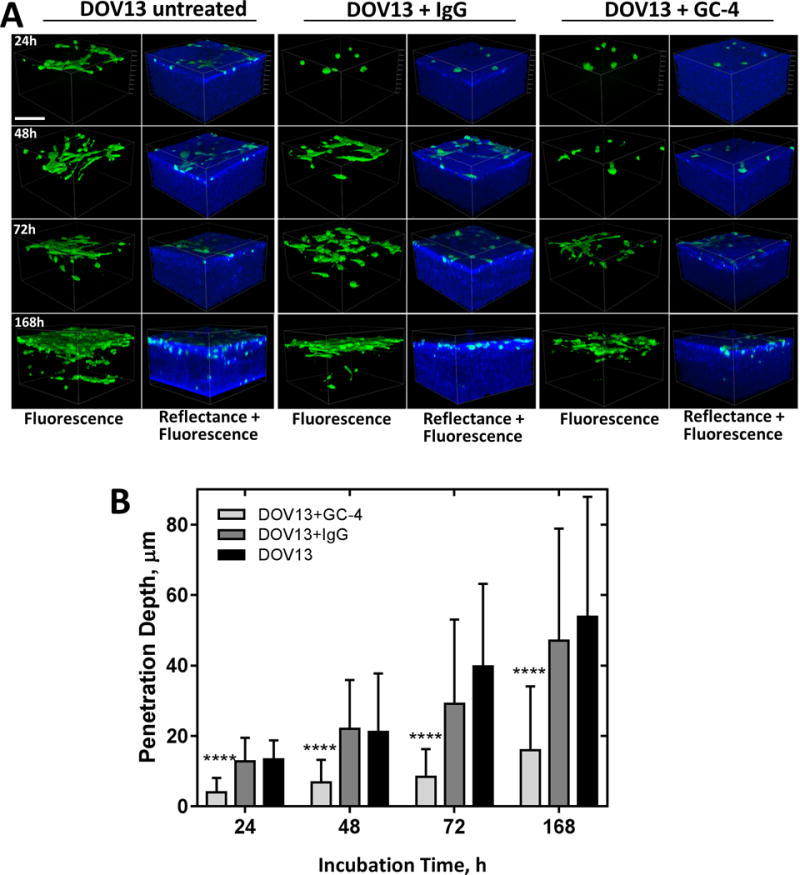
A) Individual Ncad+ DOV13 cells were applied on top of a 3D collagen gel (1.5mg/ml) inside a glass-bottom dish, and incubated in the presence of Ncad-blocking antibody clone GC-4 (200μg/ml), isotype control IgG (200μg/ml), or no drug, as detailed in Methods. Representative reconstructed 3D images of cancer cells (green, fluorescence mode) and collagen matrix (blue, reflectance mode) acquired after 0h, 24h, 72h, and 7 days of incubation. Scale bar: 100μm. B) Evaluation of matrix invasion by EOC cells at different time points of incubation in terms of penetration depth changes (M±SD, N=100). Statistical significance shown between the penetration depths of each cell type and passive beads; ****p<0.0001, Mann-Whitney U test.