
Figure 8. Cadherin-dependent sorting of EOC cells does not promote collective migration.
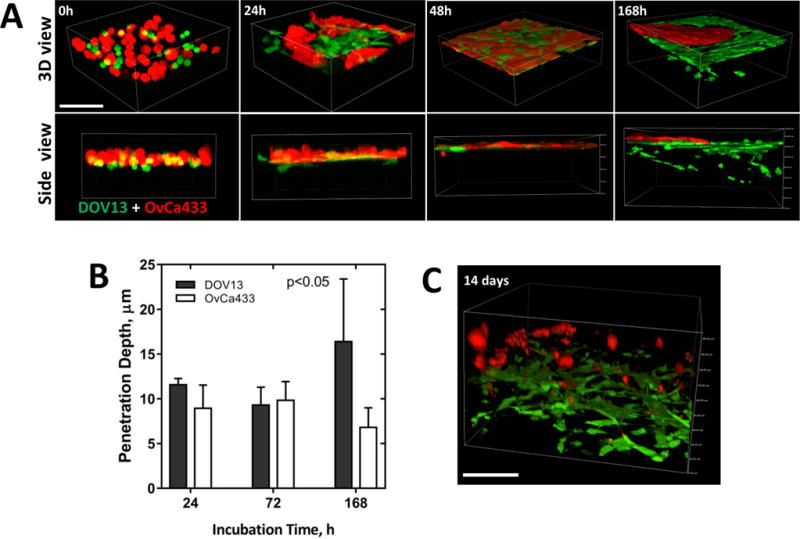
Ncad+ DOV13 and Ecad+ OvCa433 cells were applied atop 3D collagen gels (1.5mg/ml) inside a glass-bottom dish, and series of z-stack confocal images were acquired to observe cell-cell and cell-collagen interactions up to 14 days of incubation. Fluorescent and reflectance confocal modes were utilized to image cells (red, green) and collagen matrix (blue), respectively. A) Representative images of sorting and homotypic network formation (top view) and collagen invasion (3D view) at stated time points. Scale bar: 100μm. B) Evaluation of penetration depth of cell populations (M±SD, N=100 of three assays). Statistical significance is shown between the penetration depths of each cell line type and passive beads; p<0.05, Mann-Whitney U test. C) A representative 3D volume view of cellular dynamics after 14 days of incubation. Scale bar: 100μm.