
Figure 9. Cadherin composition impacts mesothelial clearance in intact tissue explants and organotypic meso-mimetic cultures.
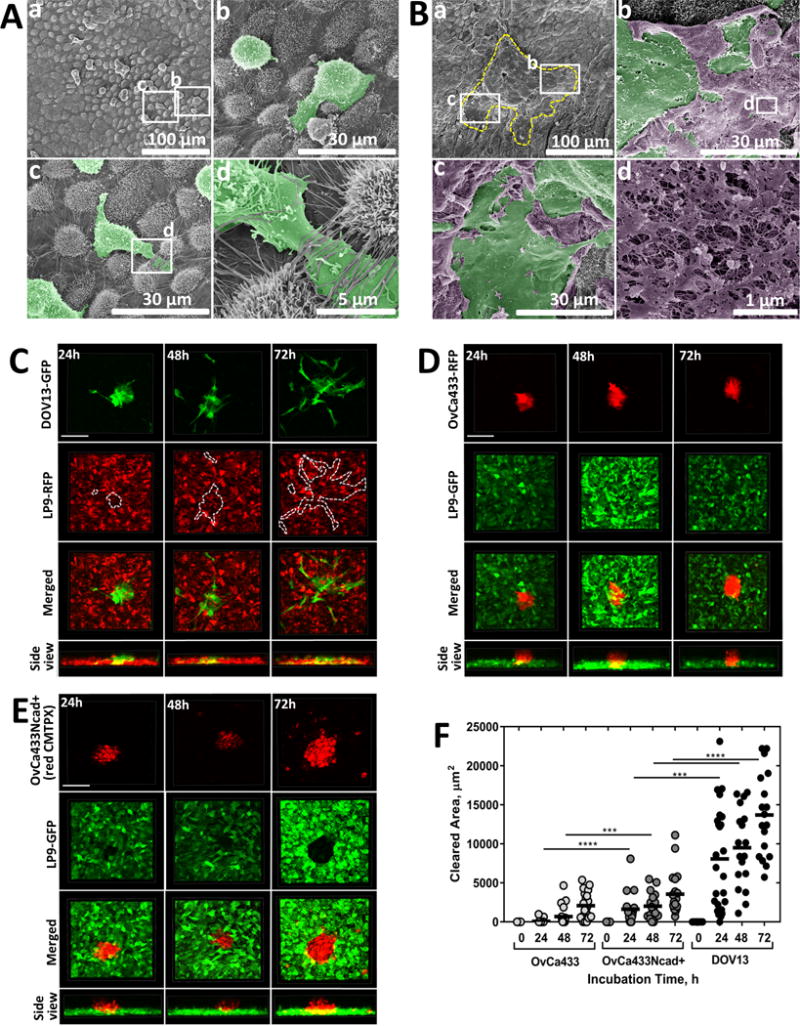
(A–B) Ex vivo peritoneal adhesion and mesothelial clearance. Murine peritoneal tissue explants were dissected and pinned ‘mesothelium-side-up’ on optically clear silastic resin as described in Methods and incubated with (A) DOV13 cells (2h) or (B) DOV13 MCAs (4h). Explants were rinsed with ice-cold PBS 3 × 3 min, subjected to SEM processing and imaged with FEI-Magellan 400 field emission microscope (scale bars as indicated). For clarity of visualization, DOV13 cells (Ab–d) and MCAs (Bb–c) are pseudo-colored green while ruptured mesothelial cells are pseudo-colored purple (Bb–d). The yellow dashed line in (Ba) depicts the borders of the dispersed MCA in the lower magnification image while the white rectangles identify areas magnified in (Bb) and (Bc), respectively. The white rectangle in panel (Bb) identifies the area of ruptured mesothelium magnified in (Bd). (C–E) Imaging of MCA mesothelial clearance using in vitro meso-mimetic cultures. (C) DOV13-GFP, (D) OvCa433-RFP or (E) CMTPX-stained OvCa433Ncad+ MCAs were applied on top of (C) RFP-tagged or (D–F) GFP-tagged LP9 mesothelial cell layers grown in 35mm glass-bottom dishes to 100% confluence, and subsequent MCA dispersal and mesothelial clearance activity (indicated by dotted line for DOV13 MCAs, visually detectable for OvCa433 and OvCa433Ncad+ MCAs) were observed using confocal microscopy during the course of incubation. (F) Mesothelial clearance was quantified in terms of the LP9 cell area cleared by the individual EOC MCAs for different incubation time points (M±SD, N=16); ***p<0.001, ****p<0.0001, Mann-Whitney U test; statistical significance is shown between different cell types.