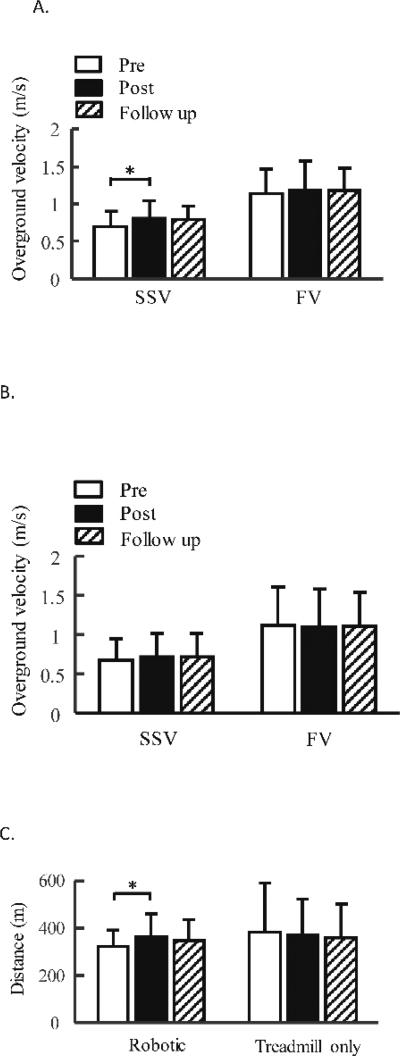
Figure 3.
Average of self-selected, fast walking velocities pre, post 6 weeks of robotic treadmill training, A, or treadmill only training, B, and 8 weeks after the end of treadmill training, i.e., follow up. Three trials were tested and averaged across each test sessions and averaged across participants for each group. C. average of 6-minute walking distance pre, post 6 weeks of robotic treadmill training or treadmill only training, and 8 weeks after the end of training. Error bars indicate standard deviation of each gait parameters (n = 10 for the robotic treadmill training group, data from one subject was excluded for 6-minute walking distance test because this subject was sick immediately before post test, which significantly impacted his endurance performance based on subject’s self-report). Error bars indicate standard deviation of each gait parameters. SSV, self-selected velocity; FV, fast velocity. * indicates significant difference, p < 0.05.

