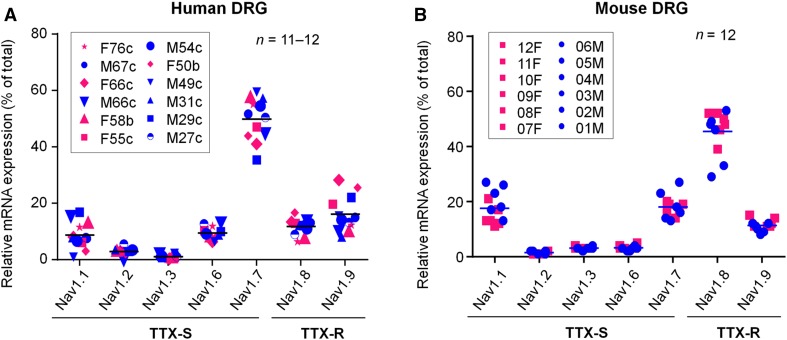
Fig. 2.
Distinct expression of sodium channel subtypes in human and mouse DRG tissues. A, B qPCR showing the relative percentage expression of TTX-sensitive Nav subtypes (TTX-S: Nav1.1, Nav1.2, Nav.1.3, Nav1.6, and Nav1.7) and TTX-resistant subtypes (TTX-R: Nav1.8 and Nav1.9) in hDRG (A) and mDRG (B) tissues. The percentage expression of each subtype is based on the total expression of all seven subtypes. Note the species differences in Nav1.6, Nav1.7, and Nav1.8 expression in hDRGs and mDRGs (n = 12 samples/group; blue, male samples; red, female samples; b, African_American; c, Caucasian; F, female; M, male.

