
Figure 8.
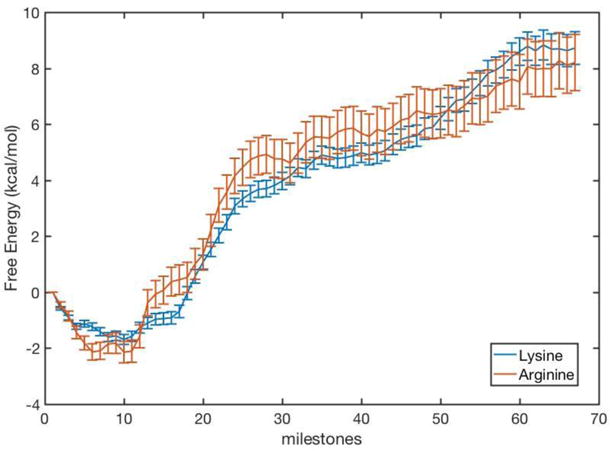
The free energy profile for the escape of PPi from HIV-RT binding site as computed with Milestoning. The curves of the native protein (lysine) and the mutant (arginine) are similar and suggest comparable kinetic behaviors (see also MFPT results in Fig. 9).