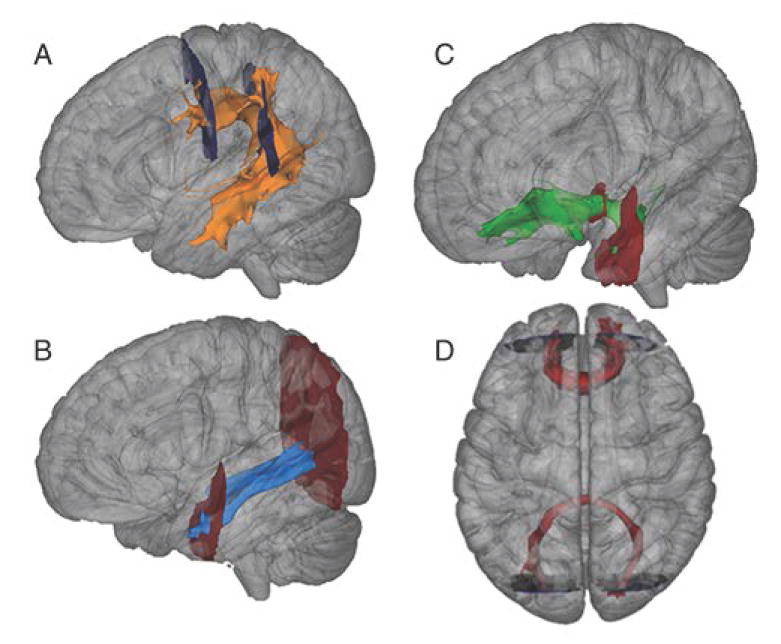
Figure 1.

Tracts of interest for probabilistic tractography analyses. Panels A-C: Tracts (from an exemplary individual TD participant) shown for left hemisphere only. A: Superior Longitudinal Fasciculus. B: Inferior Longitudinal Fasciculus. C: Uncinate Fasciculus. D: Forceps Major (bottom) and Minor (top). Start and stop masks indicated for all tracts.
