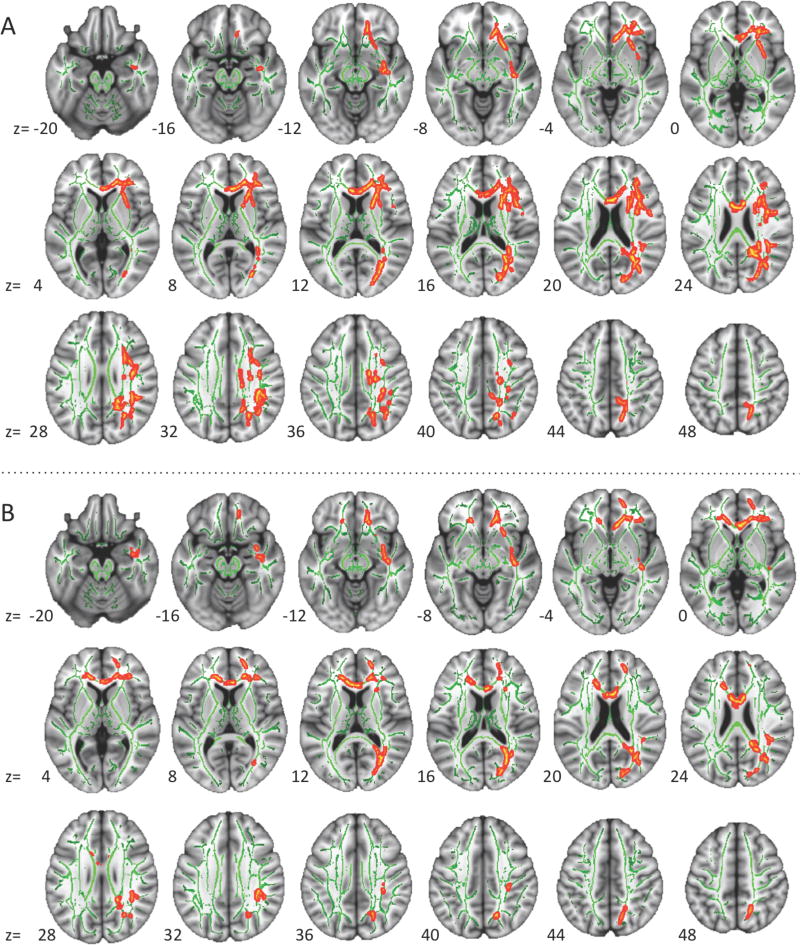
Figure 2.
Significance maps of FA effects from TBSS analyses. A: Before qualitative assessment (FS set; nASD=57, nTD=50); B: after quality control (QC set; nASD=36, nTD=39). There were no significant effects in the qualitatively matched set. Significant clusters in red-yellow after ‘thickening’ for better visibility; TBSS skeleton in green; right hemisphere displayed to the right.

