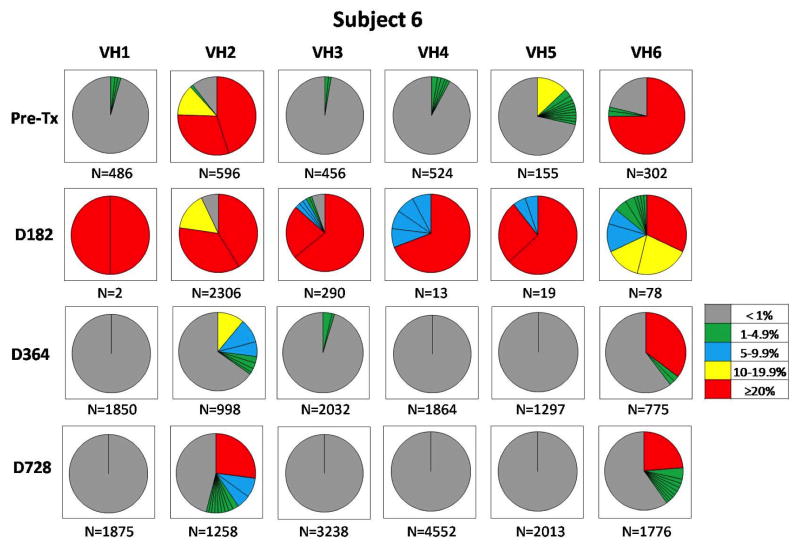
Figure 2. Subject 6 longitudinal peripheral blood IGHV repertoire analysis.
Pie chart representation of the frequency of clonotypic CDR3 sequences for each the 6 IGHV families (VH1~VH6) in the peripheral blood of subject 6. Each pie chart section represents a distinct clonotypic CDR3. The size of each section corresponds to the frequency of the clonotypic sequences among all analyzed sequences. The frequency of each clonotypic sequence is also indicated by a color code (right box). The total number of sequences analyzed for each IGHV family is indicated below each pie. IGHV, immunoglobulin heavy chain variable gene.

