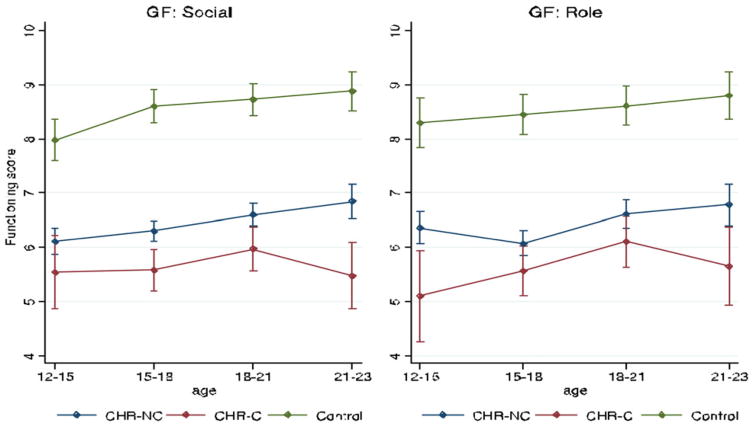
Figure 1.
(Color online) Developmental trajectories of social and role functioning. The Y-axis in the figure represents the GF: Social Scale and the GF: Role Scale scores, which range from 1 to 10, with higher scores meaning better functioning. The X-axis represents mean scores at the assessments conducted with individuals at ages 12–15, 15–18, 18–21, and 21–23.

