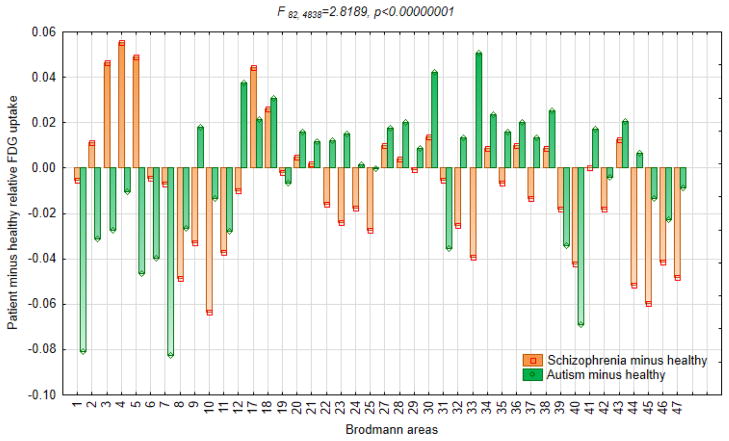
Figure 1.
Relative 18fluorodeoxyglucose uptake in subjects with schizophrenia, subjects with ASD and healthy controls.
This graph is based on the diagnostic group-by-Brodmann area interaction in ANOVA with three diagnostic groups and 42 Brodmann areas. Orange and green bars represent metabolic rates in healthy controls subtracted from metabolic rates in subjects with autism and schizophrenia respectively, so that each patient group is plotted against the zero axis line of healthy controls.

