
Figure 2.
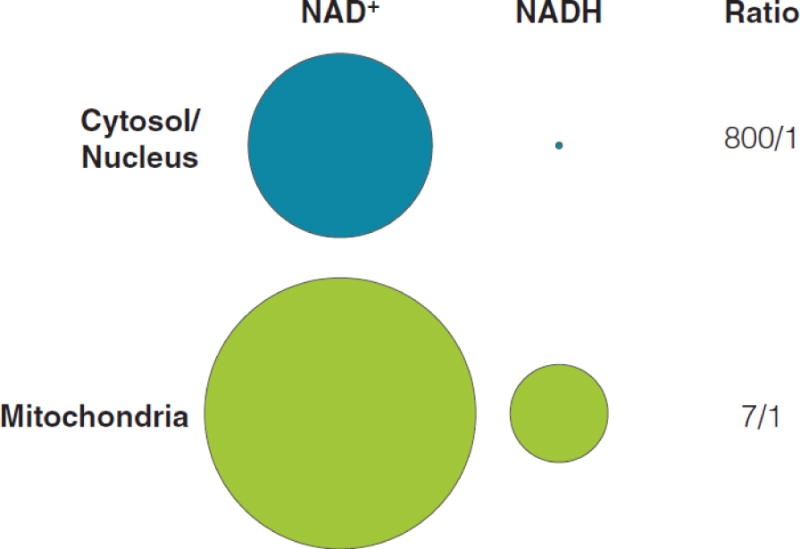
Summary sub-cellular dinucleotide pools and ratios. Based on published values, concentrations of NAD+ or NADH were converted to circle diagrams where the area of each shape accurately reflect the relative size of the nucleotide pool and the relationship between the sizes.