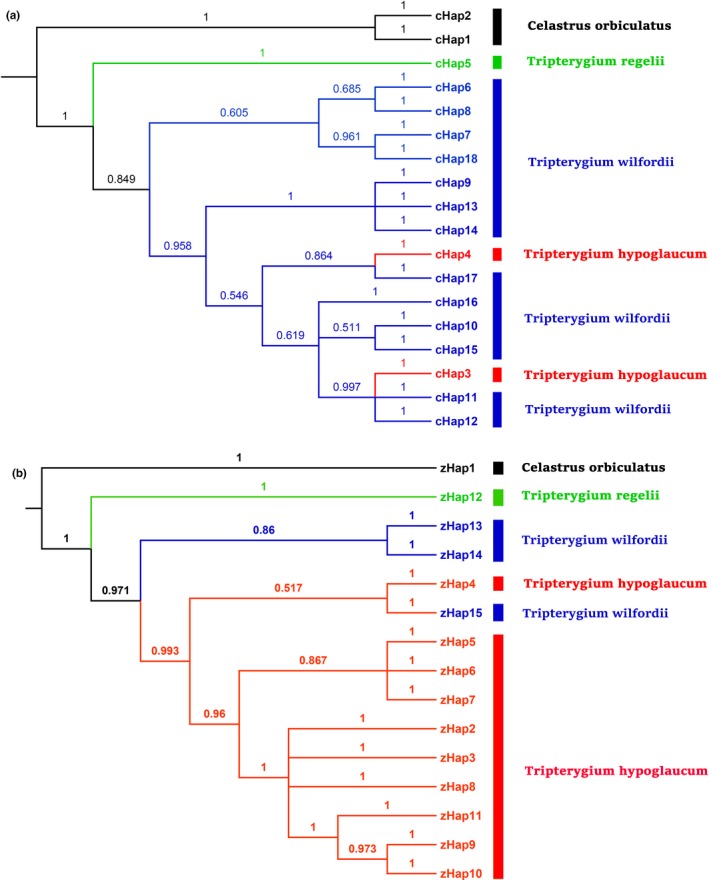
Figure 3.

Phylogenetic trees of haplotypes based on the combined three plastid DNA regions (a) (psbA‐trnH, rpl32‐trnL, and trnL‐trnF) and the combined four DNA regions (b) (ITS2, psbA‐trnH, matK, and rbcL) using Bayesian inference method. The number on each branch indicates the posterior probability (PP). Model selection: (a) GTR+I+G; (b) GTR+I. The average standard deviation of the split frequencies, (a) 0.006417; (b) 0.002667
