Figure 3.

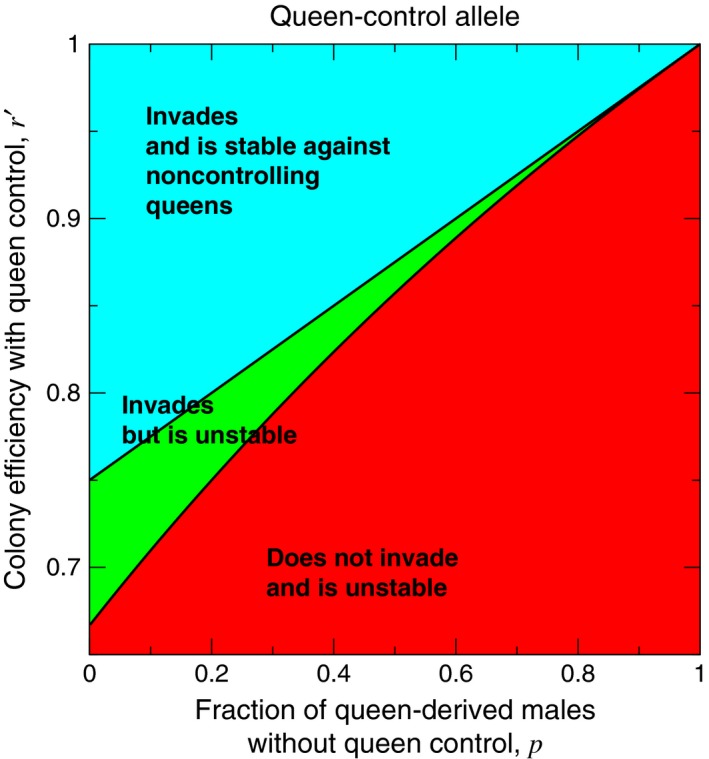
A plot of r′ versus p shows the three possibilities for the dynamical behavior of the queen‐control allele around the two pure equilibria. For this plot, we set r = 1 and p′ = 1

A plot of r′ versus p shows the three possibilities for the dynamical behavior of the queen‐control allele around the two pure equilibria. For this plot, we set r = 1 and p′ = 1