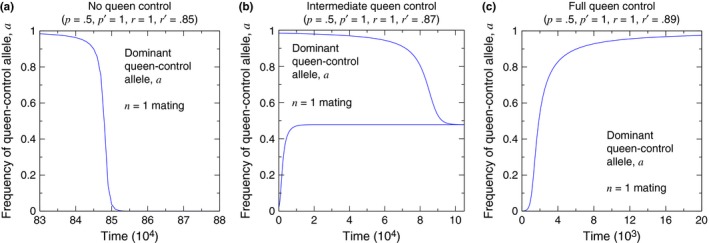
Figure 4.

Simulations of the evolutionary dynamics show the dynamical behavior of the queen‐control allele. (a) corresponds to the lower, red region in Figure 3. (b) corresponds to the middle, green region in Figure 3. (c) corresponds to the upper, blue region in Figure 3. (The initial conditions are (a) X aa, 1 = 1 − 10−3 and X aa, 0 = 10−3, (b, lower curve) X AA, 0 = 1 − 0.05 and X AA, 1 = 0.05, (b, upper curve) X aa, 1 = 1 − 0.05 and X aa, 0 = 0.05, and (c) X AA, 0 = 1 − 10−3 and X AA, 1 = 10−3.)
