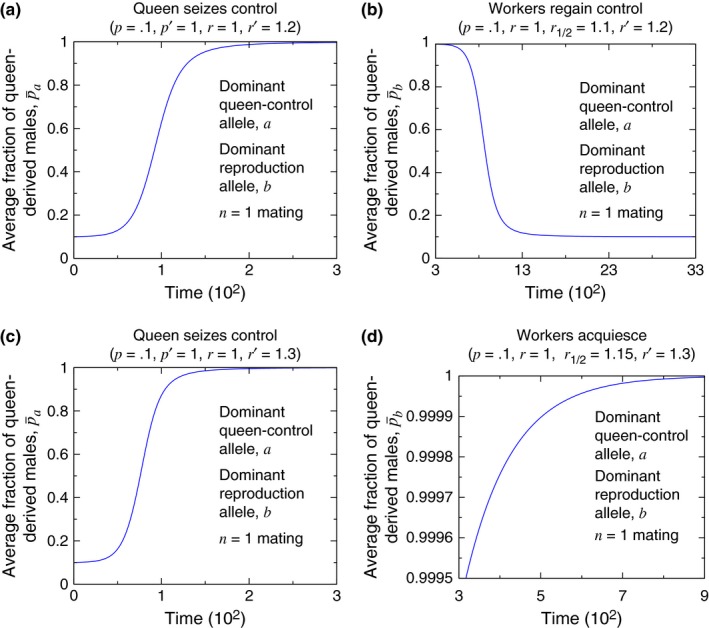
Figure 6.

Simulations reveal the behaviors shown in Figure 5. It is possible that a mutation causing queen control evolves (a), and worker reproduction is subsequently restored (b). But if the efficiency gain due to queen control is large enough, then queen control evolves (c), and workers are unable to regain reproductive ability (d). (In (b) and (d), r 1/2 denotes the colony efficiency when 1/2 of workers in the colony have the phenotype for worker reproduction. We follow the assumption for r z in Equation (5) for determining the values of r 1/2 = 1.1 (b) and r 1/2 = 1.15 (d) for these simulations. The initial conditions are (a) X AA, 0 = 1 − 10−3 and X AA, 1 = 10−3, (b) X BB, 0 = 1 − 10−3 and X BB, 1 = 10−3, (c) X AA, 0 = 1 − 10−3 and X AA, 1 = 10−3, and (d) X BB, 0 = 1 − 10−3 and X BB, 1 = 10−3. For (b) and (d), we introduce the b allele for worker reproduction at time t = 300. For panels (a) and (c), is given by Equation (12), while for panels (b) and (d), is given by Equation (13). For calculating , p 1/2 is given by the assumption for p z in Equation (5).)
