Figure 8.

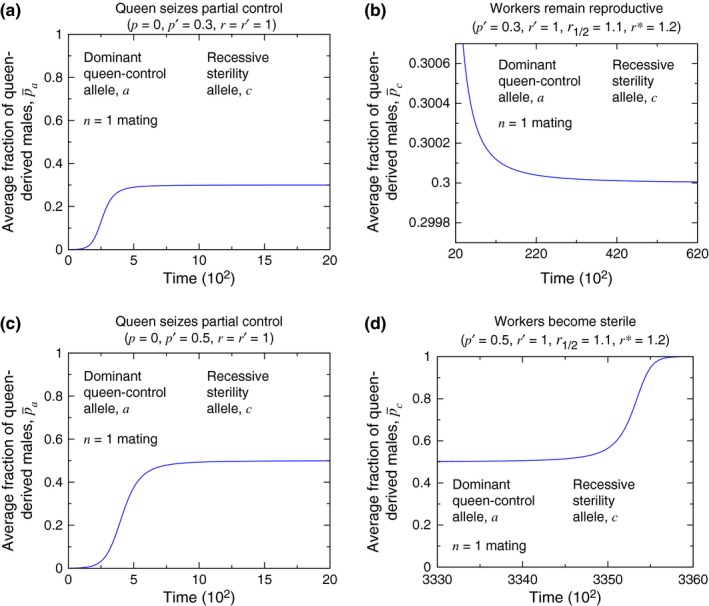
Simulations reveal the behaviors shown in Figure 7. If queens seize a small amount of control over male production (a), then a subsequent mutation, acting in workers, does not cause them to become sterile (b). If queens seize a large amount of control over male production (c), then a subsequent mutation, acting in workers, causes them to become sterile (d). Thus, queen control can facilitate the formation of a sterile worker caste. (In (b) and (d), r 1/2 denotes the colony efficiency when 1/2 of workers in the colony have the phenotype for worker sterility. We follow the assumption for r z in Equation (16) for determining the value of r 1/2 = 1.1 for these simulations. The initial conditions are (a) X AA, 0 = 1 − 10−3 and X AA, 1 = 10−3, (b) X CC, 0 = 1 − 10−1 and X CC, 1 = 10−1, (c) X AA, 0 = 1 − 10−3 and X AA, 1 = 10−3, and (d) X CC, 0 = 1 − 10−3 and X CC, 1 = 10−3. For (b) and (d), we introduce the c allele for worker sterility at time t = 2,000. For panels (a) and (c), is given by Equation (12), while for panels (b) and (d), is given by Equation (23). For calculating , p 1/2 is given by the assumption for p z in Equation (16).)
