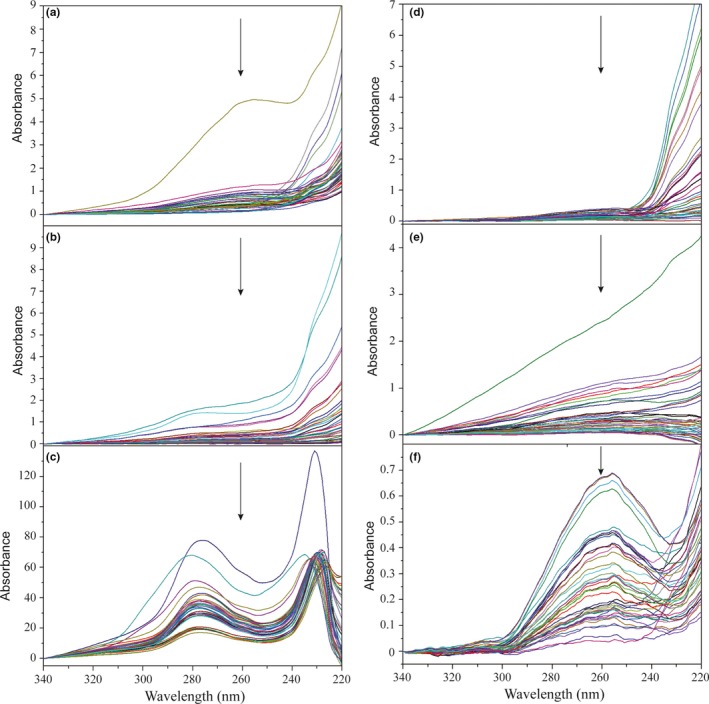
Figure 3.

UV–Vis spectra of DNA samples extracted by six protocols: (a) Ethanol precipitation using sodium chloride, (b) ethanol precipitation using ammonium acetate, (c) Chelex 5%, (d) LaboPass™ DNA Purification Kit, (e) DNeasy® Blood and Tissue Kit, and (f) PowerSoil DNA Isolation Kit. Peaks at 260 nm (demonstrated by arrows) indicate the absorbance wavelength of genomic DNA, while the lack of peaks at this wavelength implies organic contaminants such as humic acids. In six protocols, only samples extracted by PowerSoil kit show clear peaks at 260 nm
