
Figure 4.
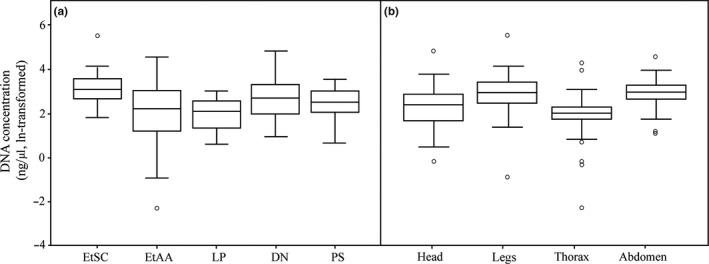
Comparison of the DNA concentration (ng/ul, ln‐transformed). (a) DNA samples extracted from five DNA extraction protocols: Ethanol precipitation using sodium chloride (EtSC), ethanol precipitation using ammonium acetate (EtAA), LaboPass™ DNA Purification Kit (LP), DNeasy® Blood and Tissue Kit (DN), and PowerSoil DNA Isolation Kit (PS). (b) DNA samples extracted from four exoskeleton parts: head, legs, thorax, and abdomen. For each box plot, the line within the box represents the mean; the top and bottom lines represent 75 and 25 percentiles of the data, respectively; top and bottom whiskers represent 95 and 5 percentiles, respectively; circles represent outliers