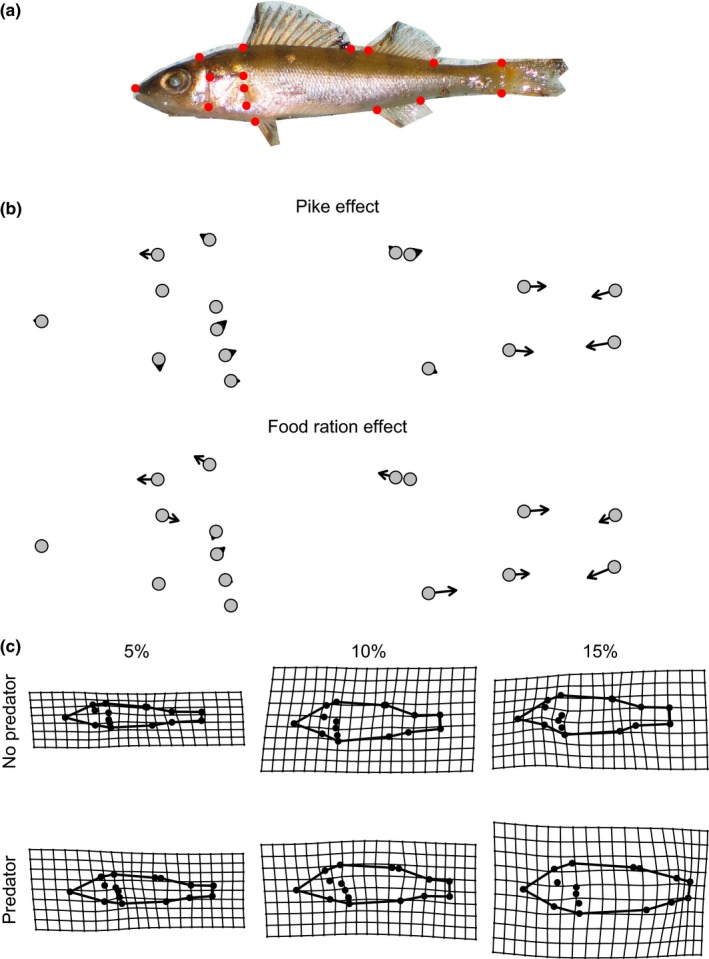
Figure 3.

Visualizations of landmarks and general shape changes as a response to pike and food treatment in perch. (a) Position of landmarks used for analyzing morphological plasticity in this study. (b) Illustrations of the main effects of pike and food treatments showing displacements (vectors) of landmarks in response to treatments. (c) Grid plots showing mean shape in the different treatment combinations
