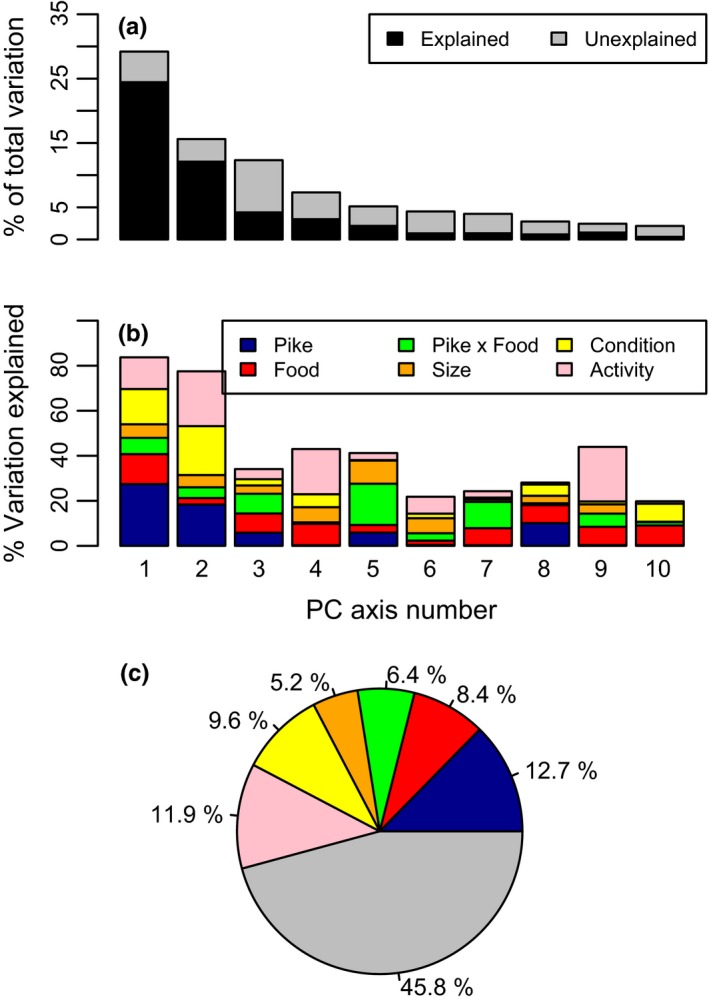
Figure 7.

Estimates of the relative effect sizes on morphology in perch in the experiment. We used the calculated PC axes, as quantitative axes summarizing among individual variation in morphology. (a) The percentage of the total morphological variation explained by each PC axes 1 through 10 (height of each bar). For each PC axis, we used an ANCOVA framework to estimate the percent variation explained by our treatments (food, pike, and the interaction food × pike), size (centroid), condition, as well as our behavioral measurements (both after 1 week and at the end of the experiment). The black portion of each PC axis bar represents the variation explained by the linear model (gray shading indicates unexplained residual variation). (b) The percent of each PC's variation explained by food, pike, the interaction food × pike, size, condition, and behavior. (c) Summing the percent variation explained by each factor, across all PC axes (not just the 10 shown here), weighted by the % of total variation attributed to each PC axis
