
Figure 5.
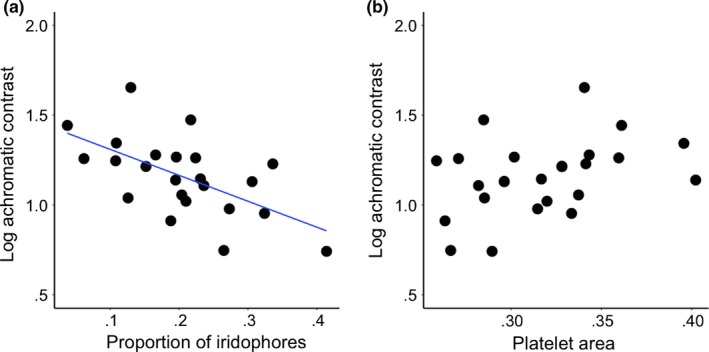
(a) Correlation between median proportion of iridophores per transect and achromatic contrast against a white background (i.e., higher achromatic contrast = lower luminance, lower achromatic contrast = higher luminance) (R 2 = 0.36). (b) Correlation between iridophore platelet spacing (the median area of platelets within 1 × 1 μm plots) and achromatic contrast (R 2 = 0.14, NS)