
Figure 4.
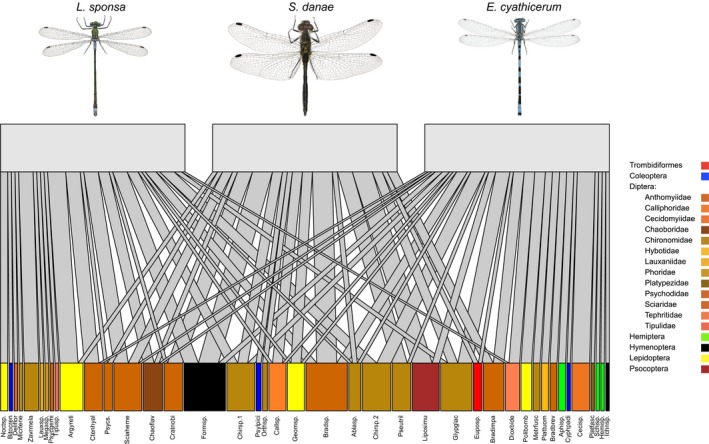
A semi‐quantitative food web of the odonate predator species and their prey, combining data from all extraction methods and both markers. The blocks in the upper row represent predators in each web and the blocks in the lower row the prey species. A line connecting a predator with a prey represents a detected predation event, and the thickness of the line represents the proportional frequency of each predation event. The web was drawn using method “cca” which minimizes the cross‐links between predators in R package “bipartite” (Dormann et al., 2009). Only the male pictures are shown, although the web is constructed from both sex diets. Pictures of odonates adopted from Norske Art databank under Creative Commons License (CC BY 4.0)