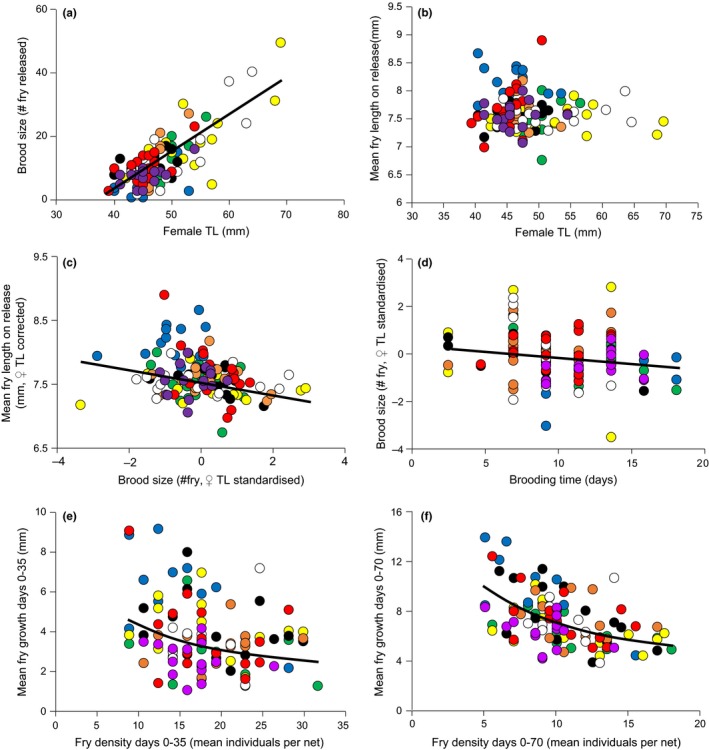
Figure 4.

Experiment 2: Associations between: (a) brood size and maternal TL. (b) mean fry TL on release and maternal TL. (c) fry TL and brood size by standardized maternal TL. (d) incubation period and brood size by standardized maternal TL. (e) fry growth between days 0–35 in relation to fry density. (f) fry growth between days 0–70 in relation to fry density. For population color codes see Figure 1
