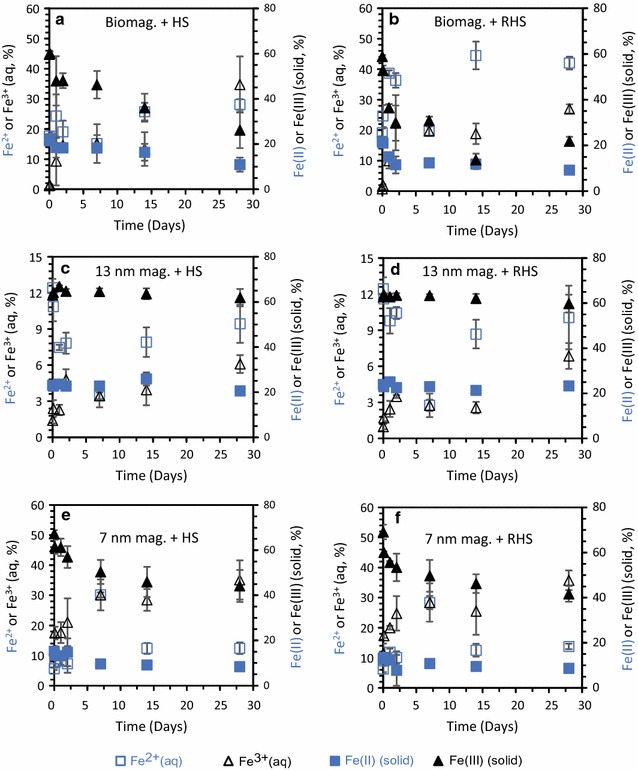
Fig. 3.

Changes in Fe concentrations during incubation of 1 g/L of biogenic, 13 nm and 7 nm magnetite with 0.6 g/L native or reduced HS. All concentrations are expressed as percentage of total Fe concentration for total aqueous Fe2+ (open squares), total aqueous Fe3+ (open triangles), solid Fe(II) (filled squares) and solid Fe(III) (filled triangles) in a biogenic magnetite incubated with native HS, b biogenic magnetite incubated with reduced HS, c 13 nm magnetite incubated with native HS, d 13 nm magnetite incubated with reduced HS, e 7 nm magnetite incubated with native HS, and f 7 nm magnetite incubated with reduced HS. Standard deviations of all experiments were calculated from three independent parallels
