
Fig. 36.
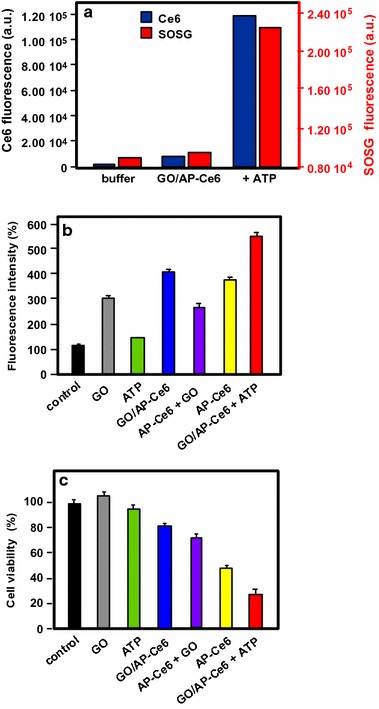
a The Ce6 and SOSG signal readouts after irradiation condition (404 nm, 10 min). b DCF fluorescence intensity in HepG2 cells. c Cellular viability of HepG2 cells treated with light
[Taken from reference (Yan et al. 2014)]
Official websites use .gov
A
.gov website belongs to an official
government organization in the United States.
Secure .gov websites use HTTPS
A lock (
) or https:// means you've safely
connected to the .gov website. Share sensitive
information only on official, secure websites.
a The Ce6 and SOSG signal readouts after irradiation condition (404 nm, 10 min). b DCF fluorescence intensity in HepG2 cells. c Cellular viability of HepG2 cells treated with light
[Taken from reference (Yan et al. 2014)]